Quantifying harm in the presence of heterogeneous effects of an infringement

Share
When firms form cartels, damages estimates in follow-on litigation typically assume that all customers were equally affected. In this article, Daniel Ball, Esteban Cattaneo, Jasper Haller and Soledad Pereiras [1] challenge that assumption by exploring recent econometric advances in estimating “heterogeneous treatment effects” – a formal way of expressing how a market intervention of interest may have affected different units differently. They show that ignoring heterogeneity can lead to biased estimates of harm, and discuss practical methods to identify and address these differences using both regression-based and machine-learning approaches.
Introduction
When firms form cartels to agree on prices or other parameters of competition, their customers suffer damage. The purpose of follow-on litigation, as expressed in the Damages Directive, is to allow those who have suffered from the cartel to claim compensation for the harm they have suffered.[2]
In practice, this usually involves a two-step process of determining (i) the market-wide average overcharge per unit sold and (ii) the number of units purchased by a particular claimant. This process has the implicit assumption that the cartel had the same effect on all affected products.
Depending on the circumstances of the case, this assumption may not be appropriate. Could a particular customer have suffered an overcharge higher or lower than the market-wide average? This is not merely an academic question. The effectiveness of a cartel may be different for different geographies or product classes and can also vary over time.[3] Clearly, a customer should feel entitled to greater compensation if they happened to purchase their products in geographies, periods, or product classes that were subject to especially high overcharges.[4]
Whilst intuitive enough, the idea of heterogeneous effects has received relatively scant attention in practice. In our experience, practitioners who estimate damages do not usually investigate systematically whether a cartel could have given rise to varying overcharges, contenting themselves with estimating a single average effect instead. This longstanding practice is reflected in a number of methodological texts which describe a “standard toolkit” of methods for quantifying market-wide average overcharges, such as the European Commission’s Practical Guide on quantifying antitrust harm in action for damages (the “Practical Guide”). A common thread in this literature is that it only considers the possibility of an average overcharge.[5]
However, in recent years, the field of econometrics has made tremendous advances in estimating “heterogeneous treatment effects”, which is a formal way of expressing the idea that a market intervention of interest (such as a cartel) may have affected different units differently.[6] In this article, we highlight two main insights from this literature for cartel damages estimation; one troubling and one hopeful:
- It turns out that estimating homogeneous treatment effects when they are truly heterogeneous can lead to significant error. If cartel effects truly are heterogeneous, intuition might suggest that this estimated effect is an average. The troubling finding is that this intuition is wrong: the estimated effect can be significantly different from the average across all products sold during the cartel.
- Luckily, the econometric literature has developed a number of practical techniques to test for heterogeneous treatment effects and to estimate them.
Heterogeneous effects: isolating the problem
The Practical Guide uses a hypothetical example of milling companies colluding to fix the price of flour.[7] We will use this example to illustrate the topic, assuming that:
- Data are available for the cartelised product and geographic market, and the overcharge is estimated using a time comparison with the period immediately after the end of the cartel.
- Costs and demand factors are constant over time. Effectively, the world after the cartel is the same as the cartelised world absent any cartel.
Homogeneous vs heterogeneous effects
We now let the milling companies produce two types of flour, regular (cheap) and wholemeal (expensive). The sales proportion of both types of flour was 50/50 during the cartel period and remained the same after the cartel period.
We first consider a simple approach, where the overcharge is estimated by comparing average prices during and after the cartel. The two figures below illustrate how this approach fares when the actual overcharge is the same (homogeneous effects, Figure 1) or differs (heterogeneous effects, Figure 2) between products.
Figure 1: Illustration of means comparison under homogeneous effects – fixed sample composition
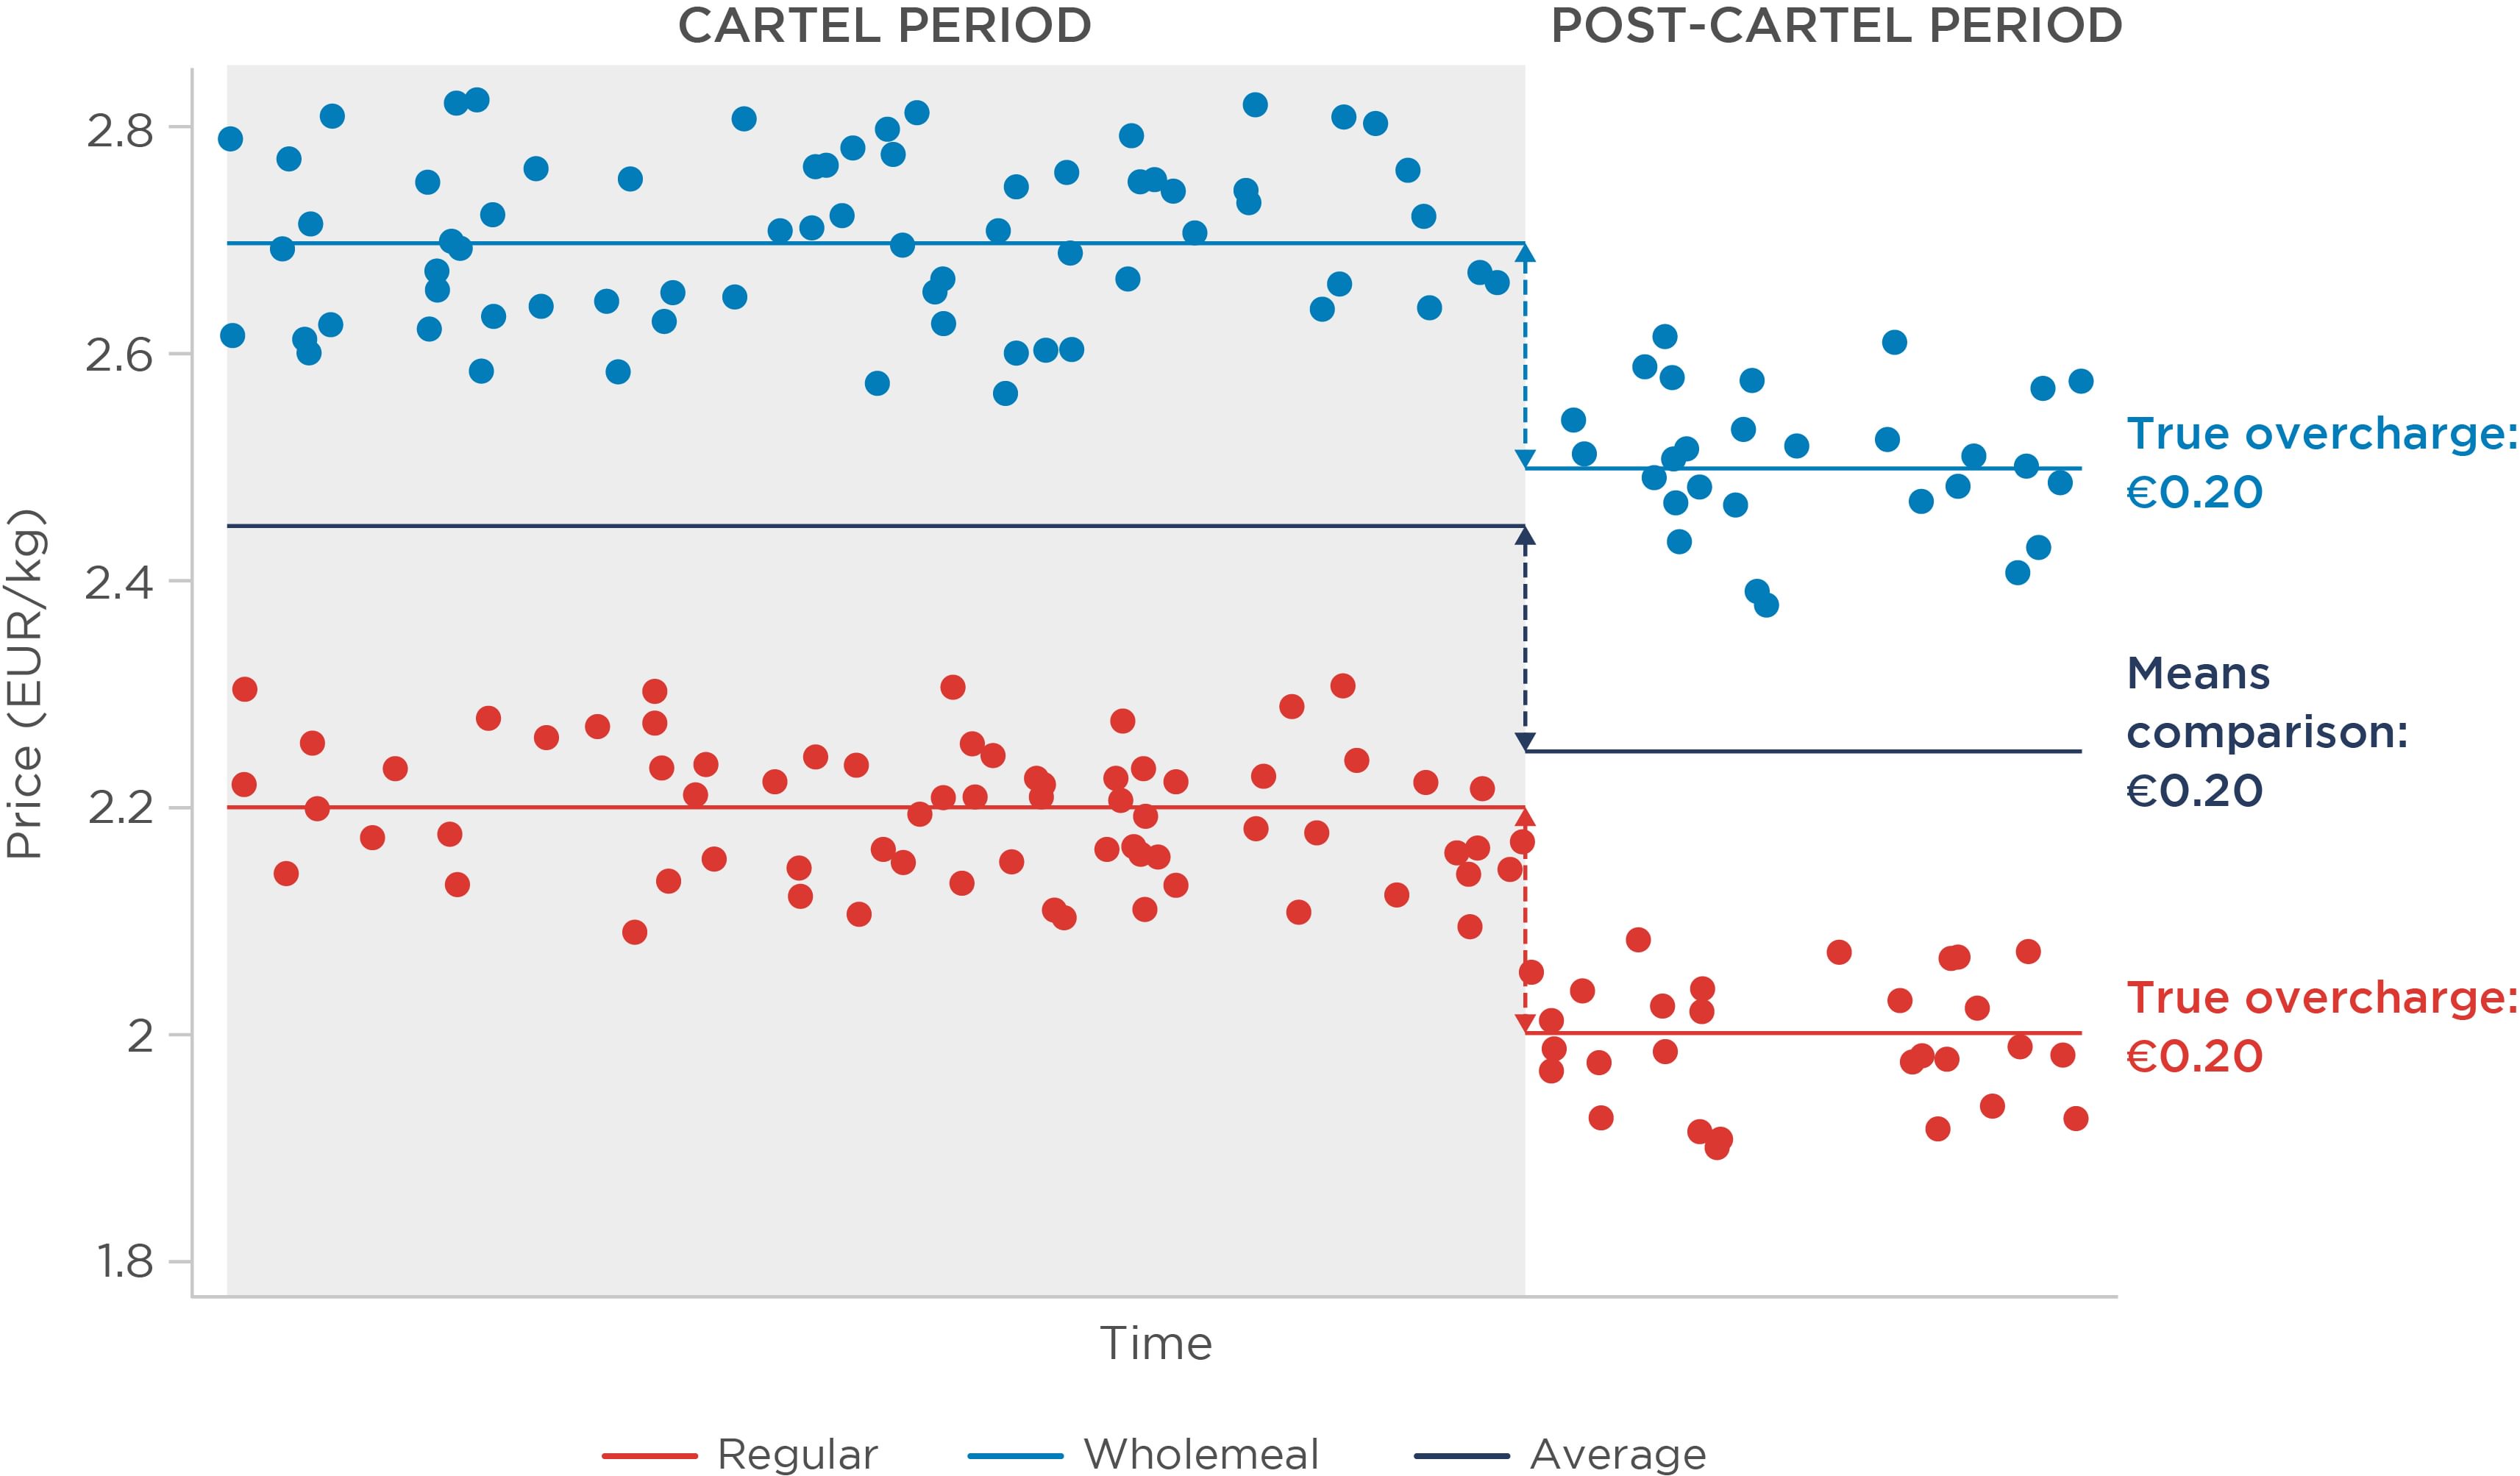
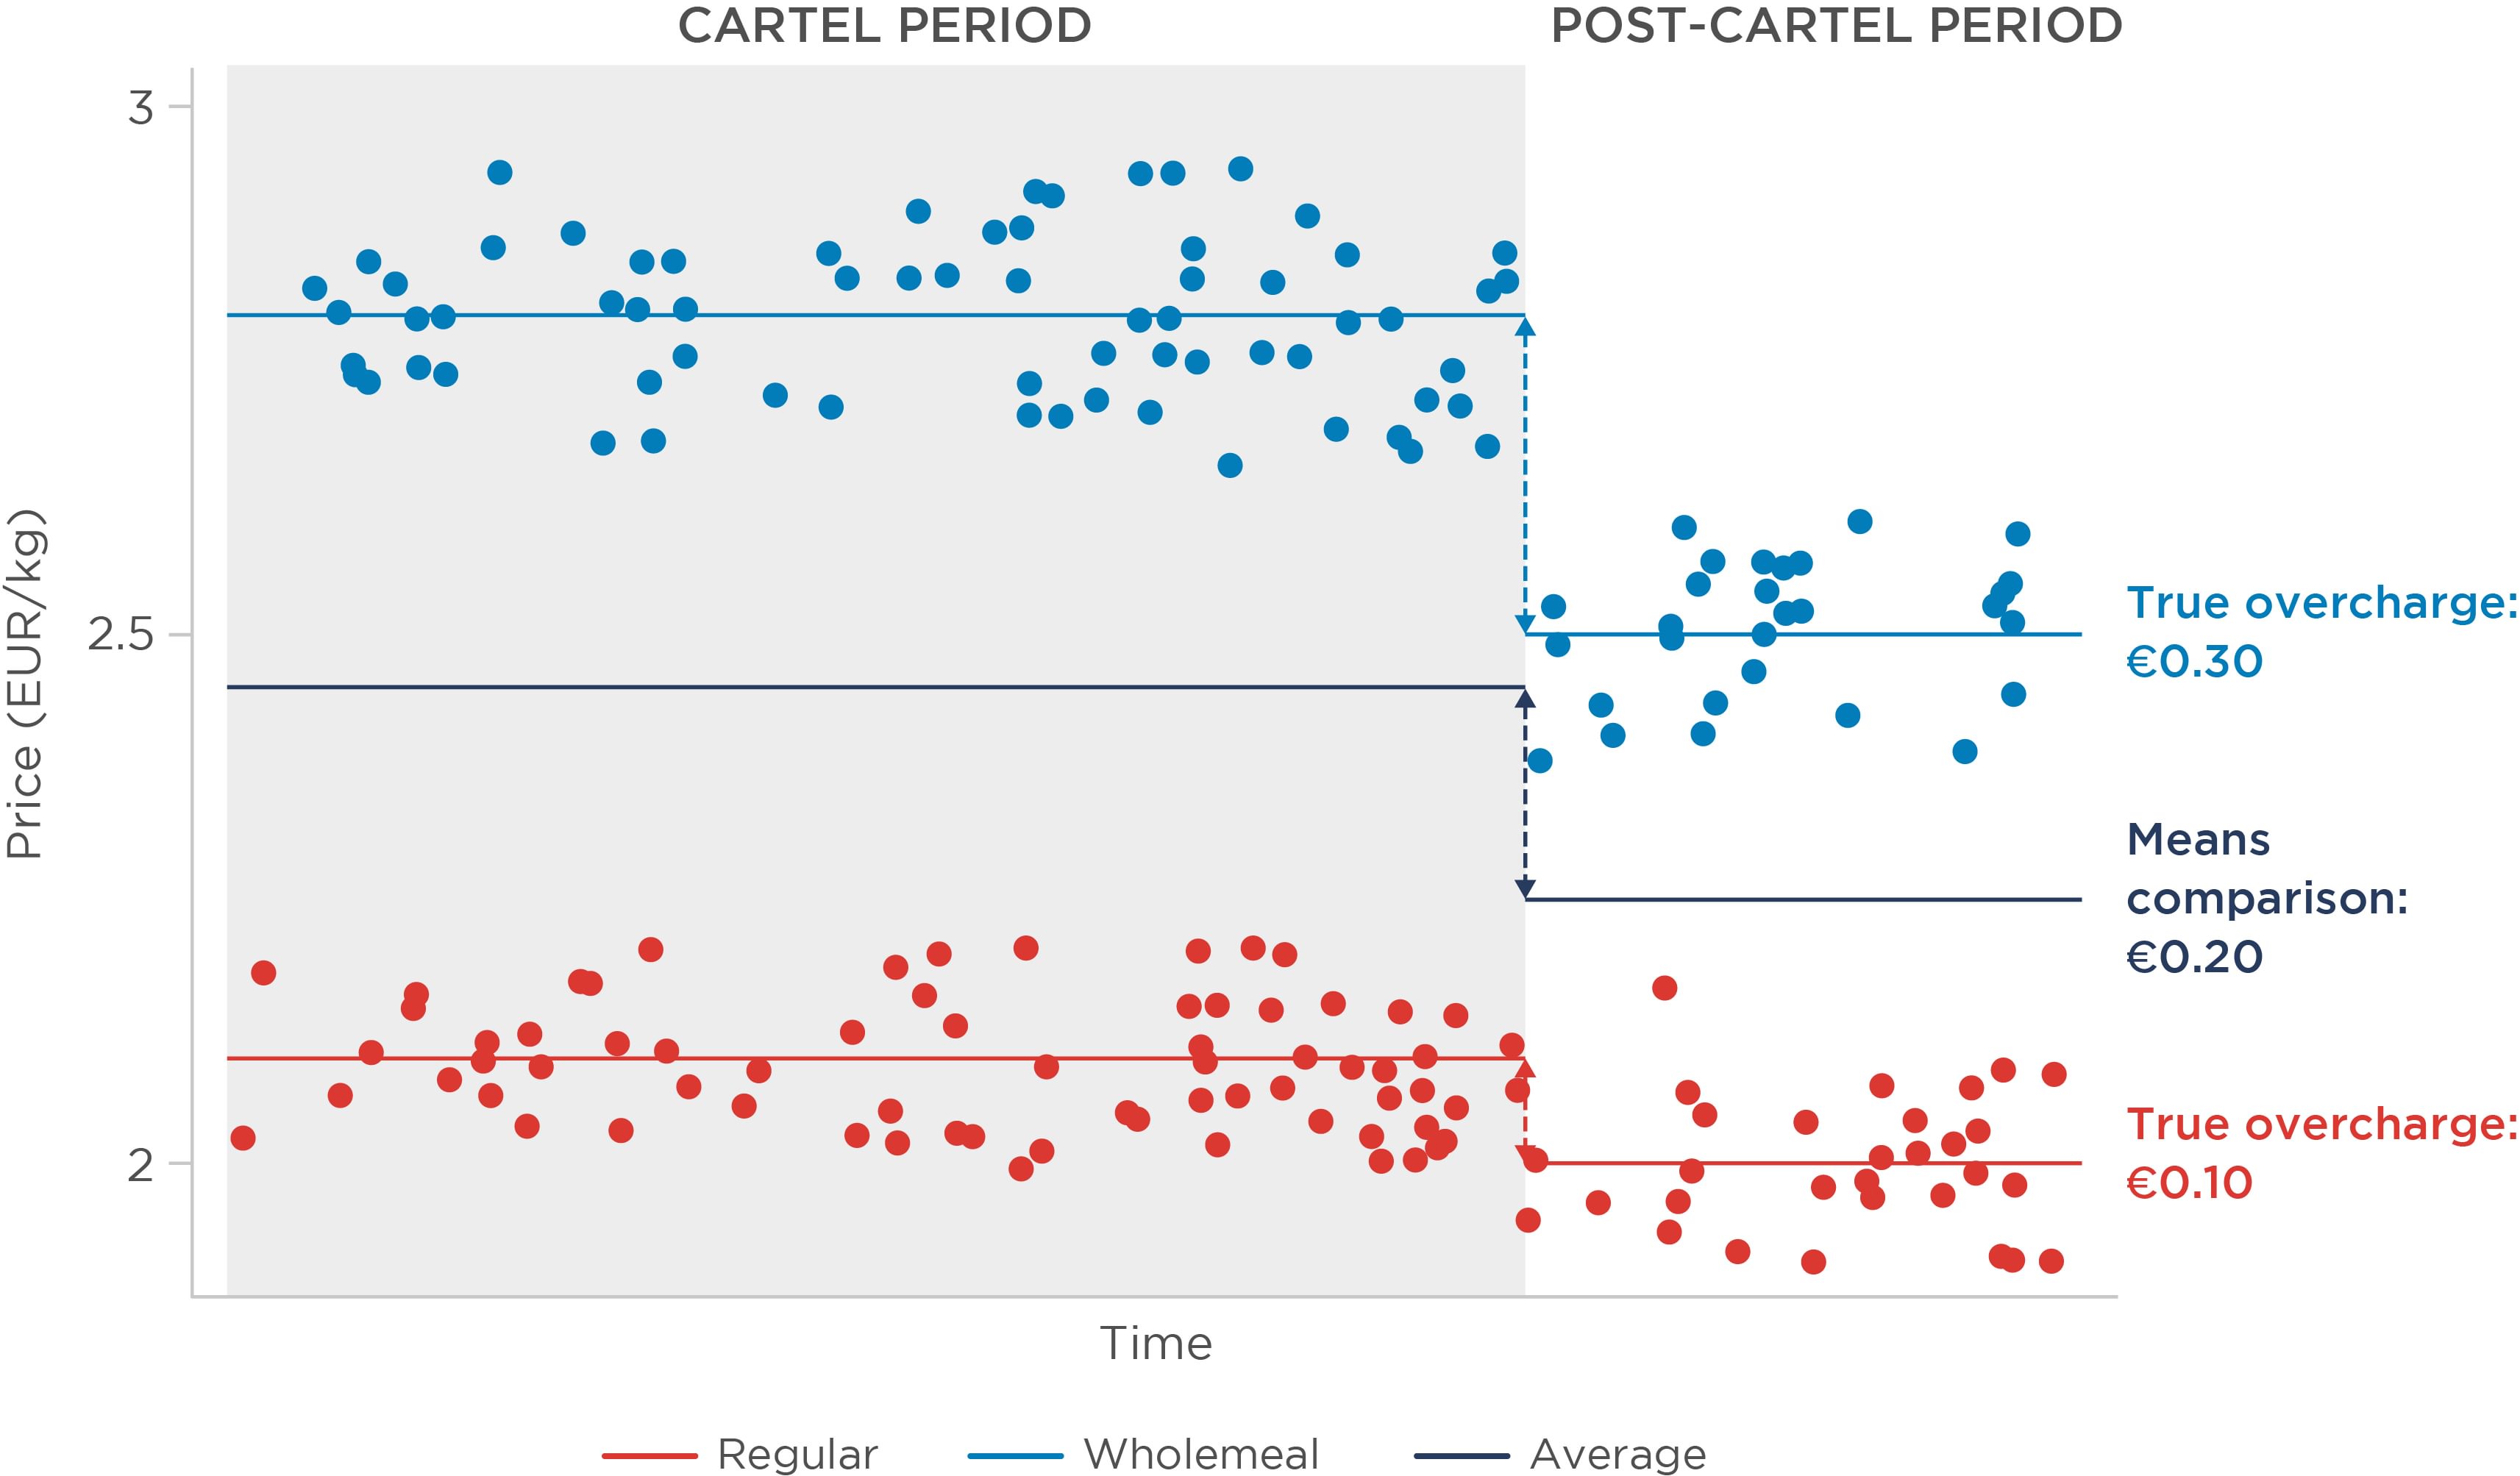
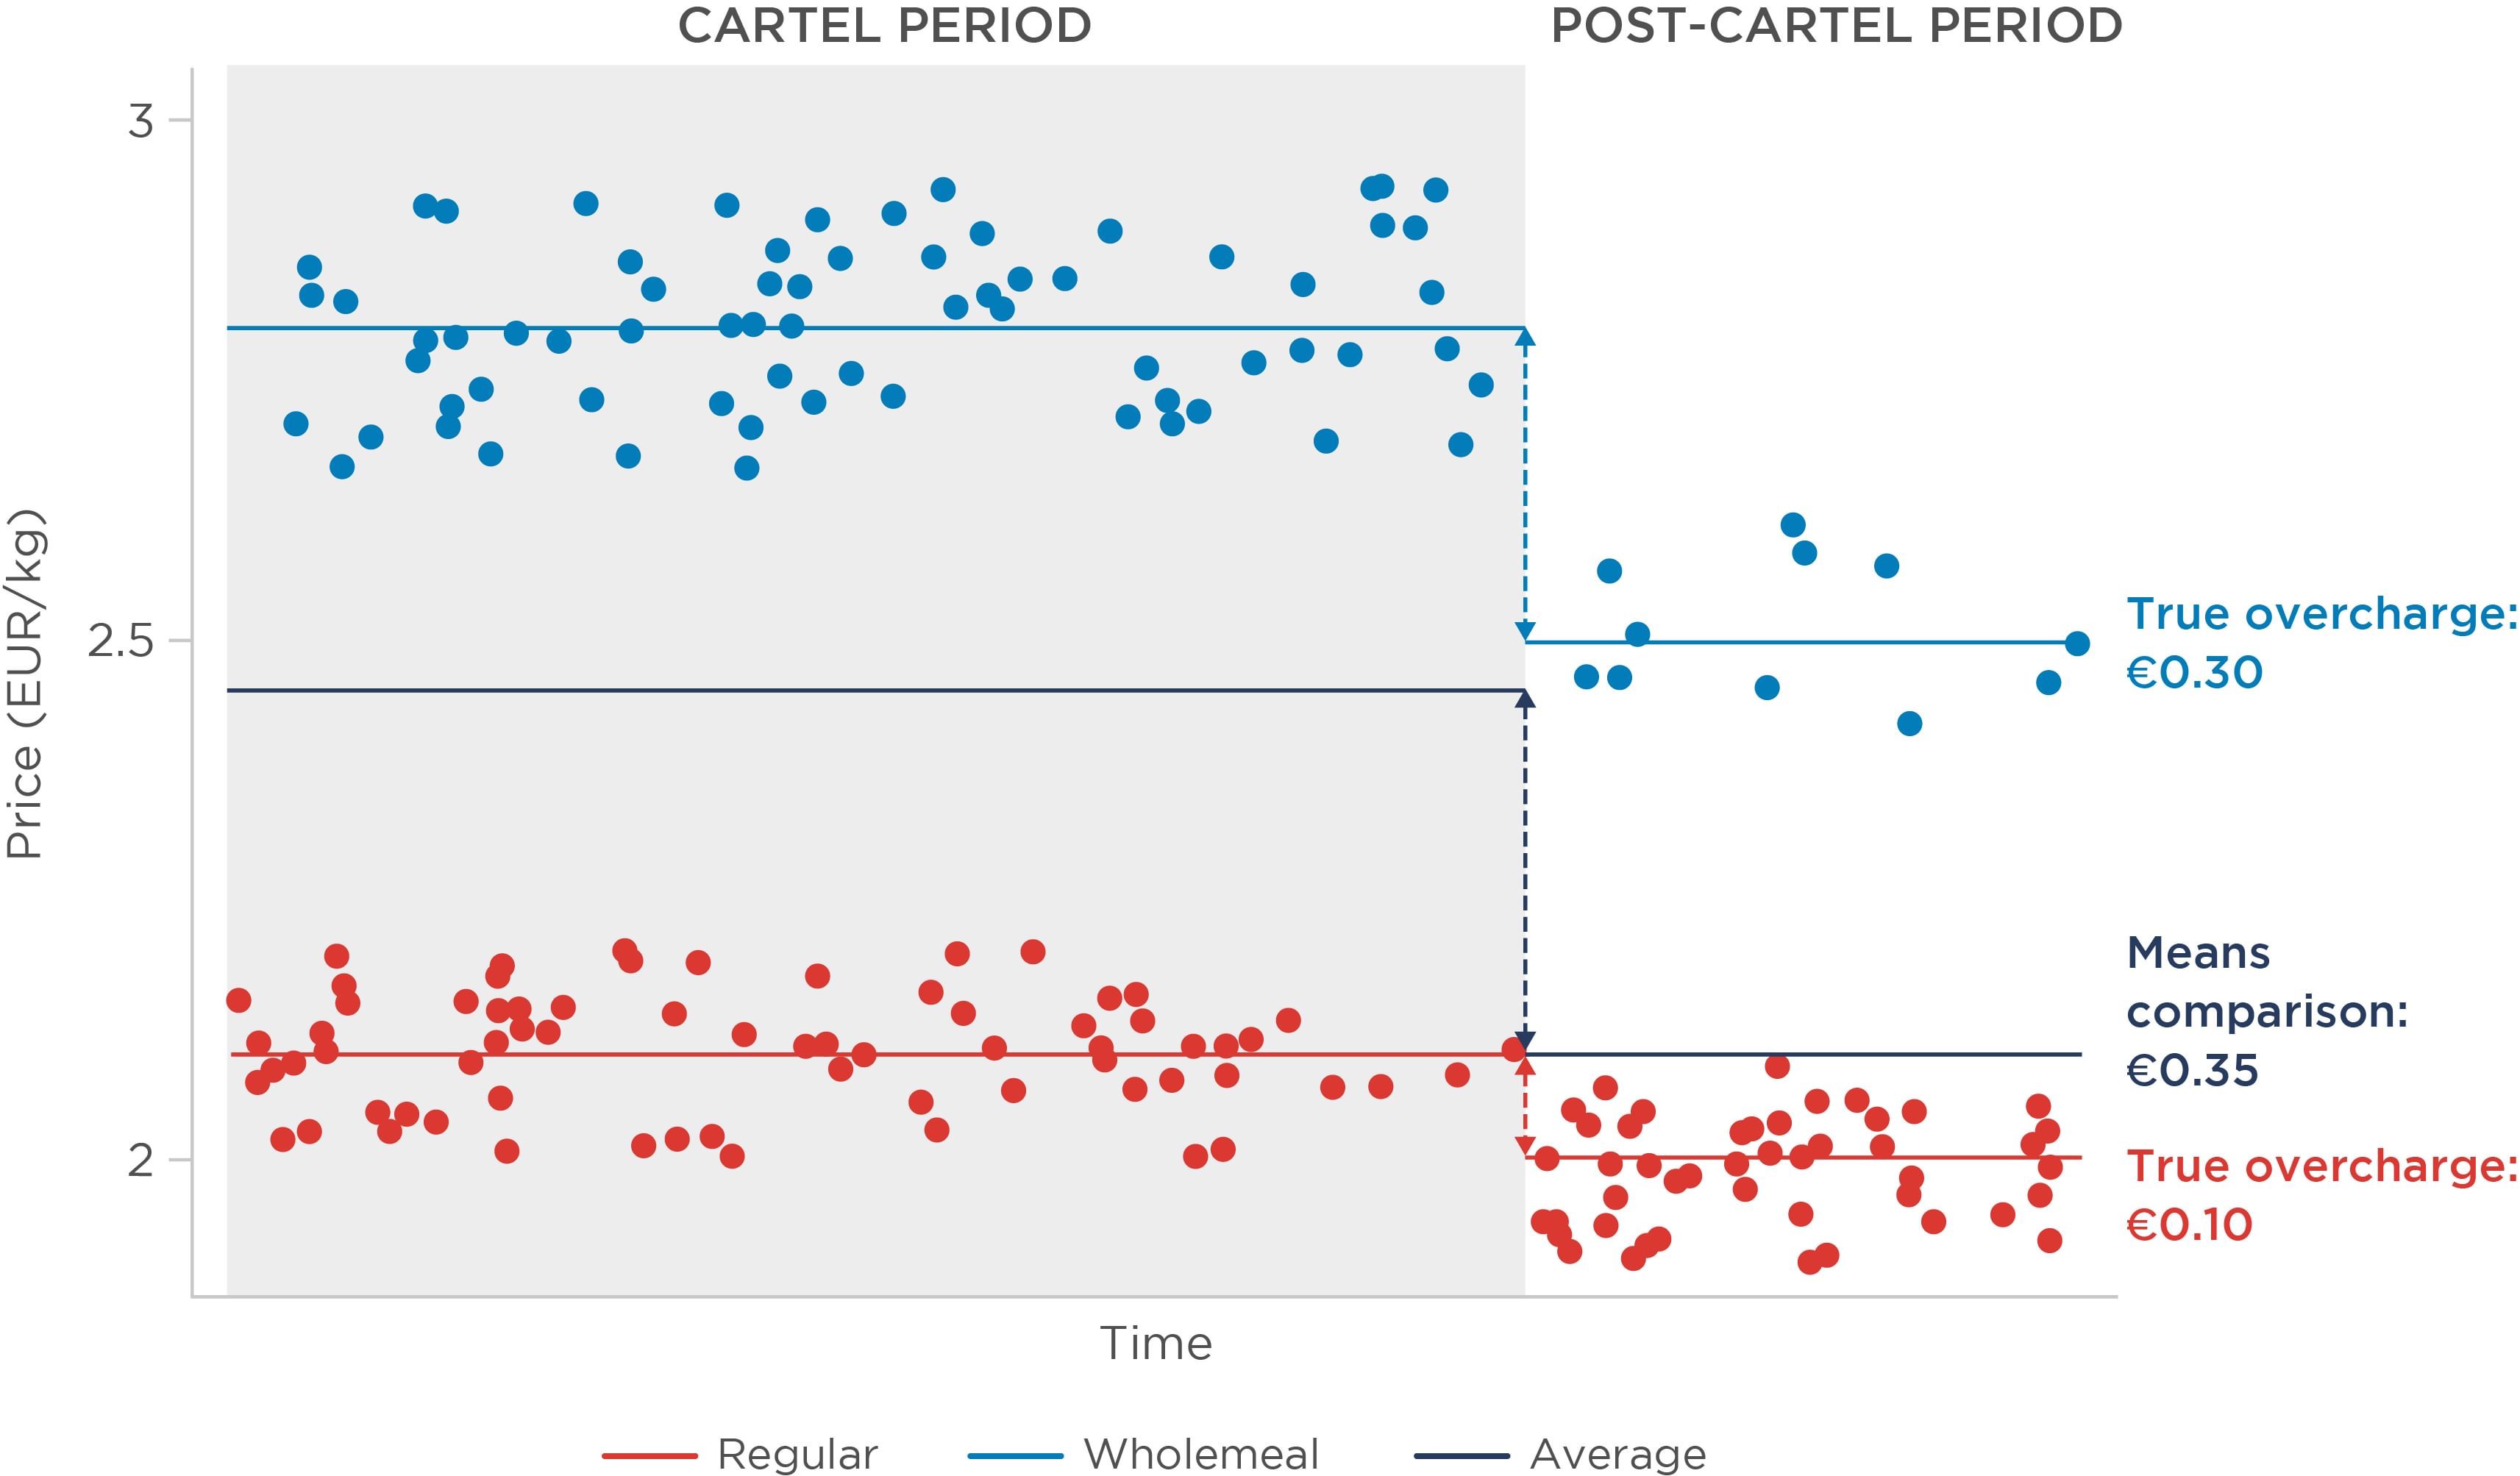
Figure 2: Illustration of means comparison under heterogeneous effects – fixed sample composition
When effects are homogeneous (Figure 1), a simple means comparison correctly estimates the average overcharge at €0.20/kg, and the overcharge does not vary with the type of flour purchased by the claimant. This scenario therefore lends itself to the standard toolkit.
When effects are heterogeneous (Figure 2), the true overcharge varies between regular (€0.10/kg) and wholemeal (€0.30/kg) flour. This can happen in different circumstances and for different reasons. For example, the cartel may cover a larger share of the supply of wholemeal flour, or the demand for wholemeal flour may be less elastic. A single estimate is not sufficient to convey this range of overcharges, and instead merely results in an average of the two effects.
When relying on means comparisons or regression analysis leading to a single average effect, the results should therefore be interpreted cautiously. Where heterogeneous effects are anticipated, practitioners need to explicitly acknowledge that they are, at best, capturing the average effect across all customers. A customer who bought more of one product than another will then receive inappropriate compensation.
Introducing changes in sample composition
If, instead, we assume that the proportion of sales changed after the end of the cartel – for example, 80/20 for regular and wholemeal flour, respectively – a simple comparison of means may not provide a correct estimate even in the case of homogeneous effects (Figure 3).[8]
Figure 3: Illustration of means comparison under homogeneous effect – varying sample composition
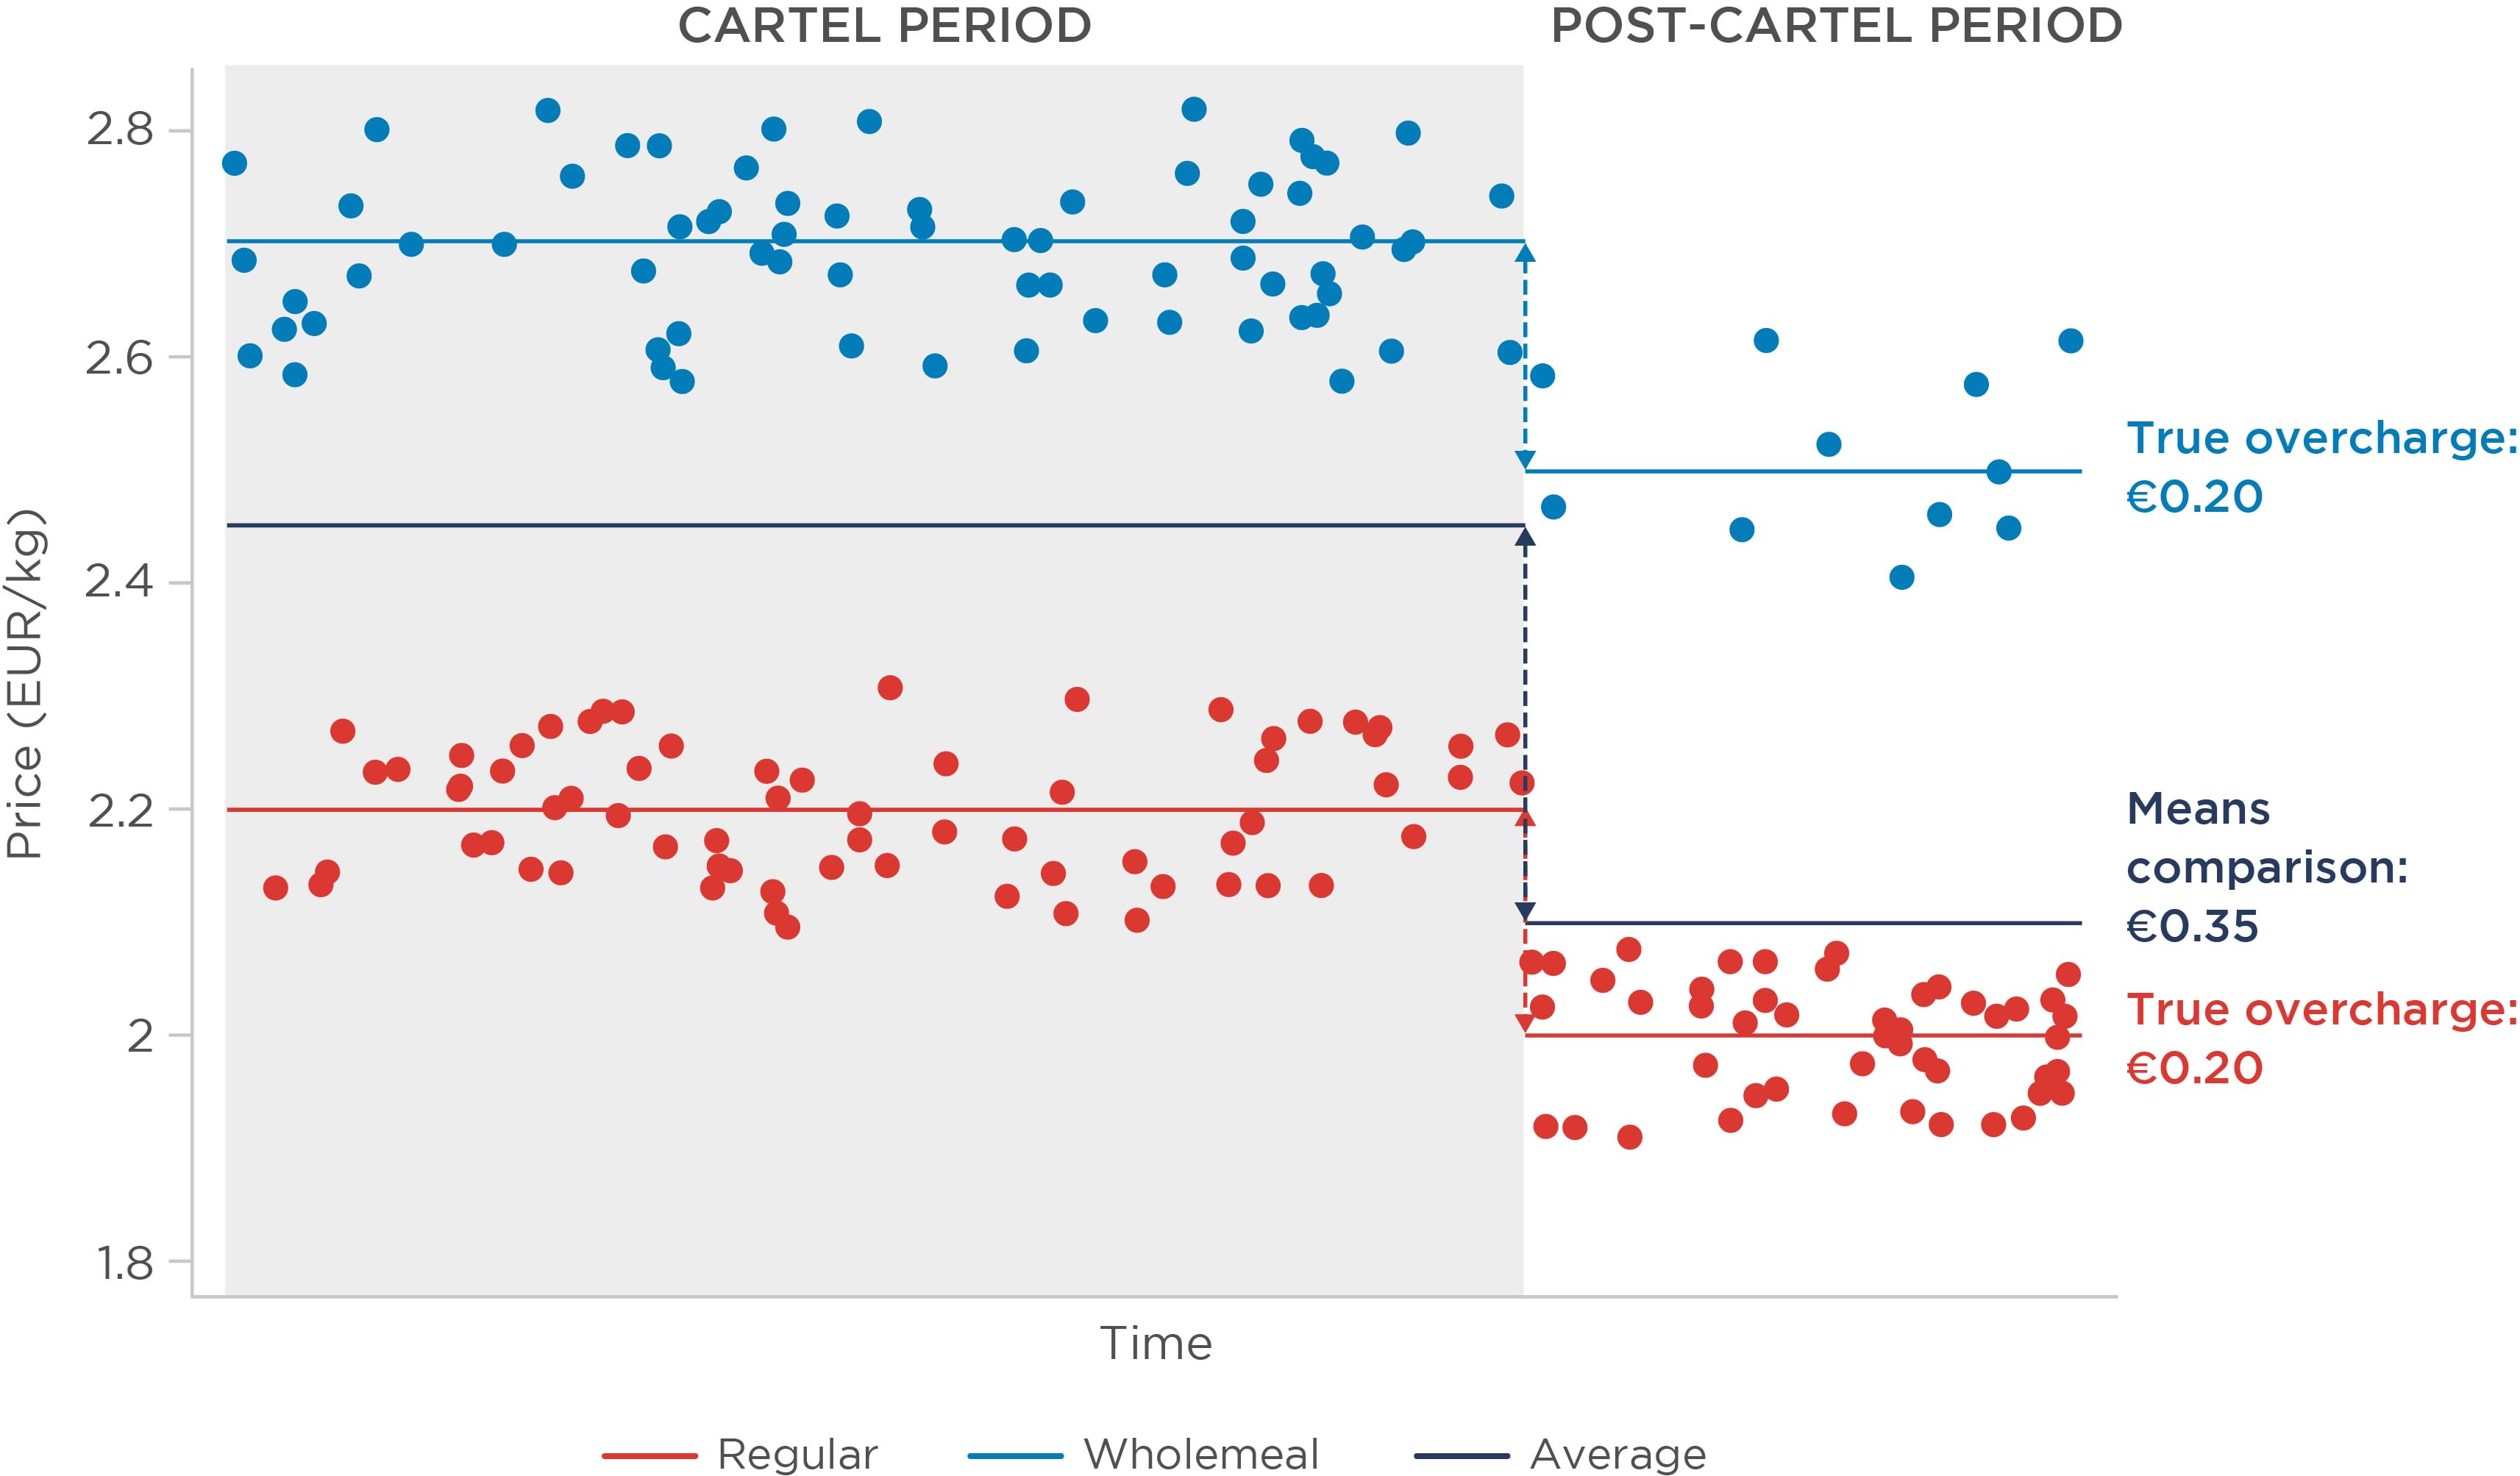
As illustrated, the combined average price after the cartel period is now much lower than in either of our previous examples. However, the larger estimated overcharge is simply driven by the composition change, as the end of the cartel coincides with an increase in sales of the cheaper type of flour.
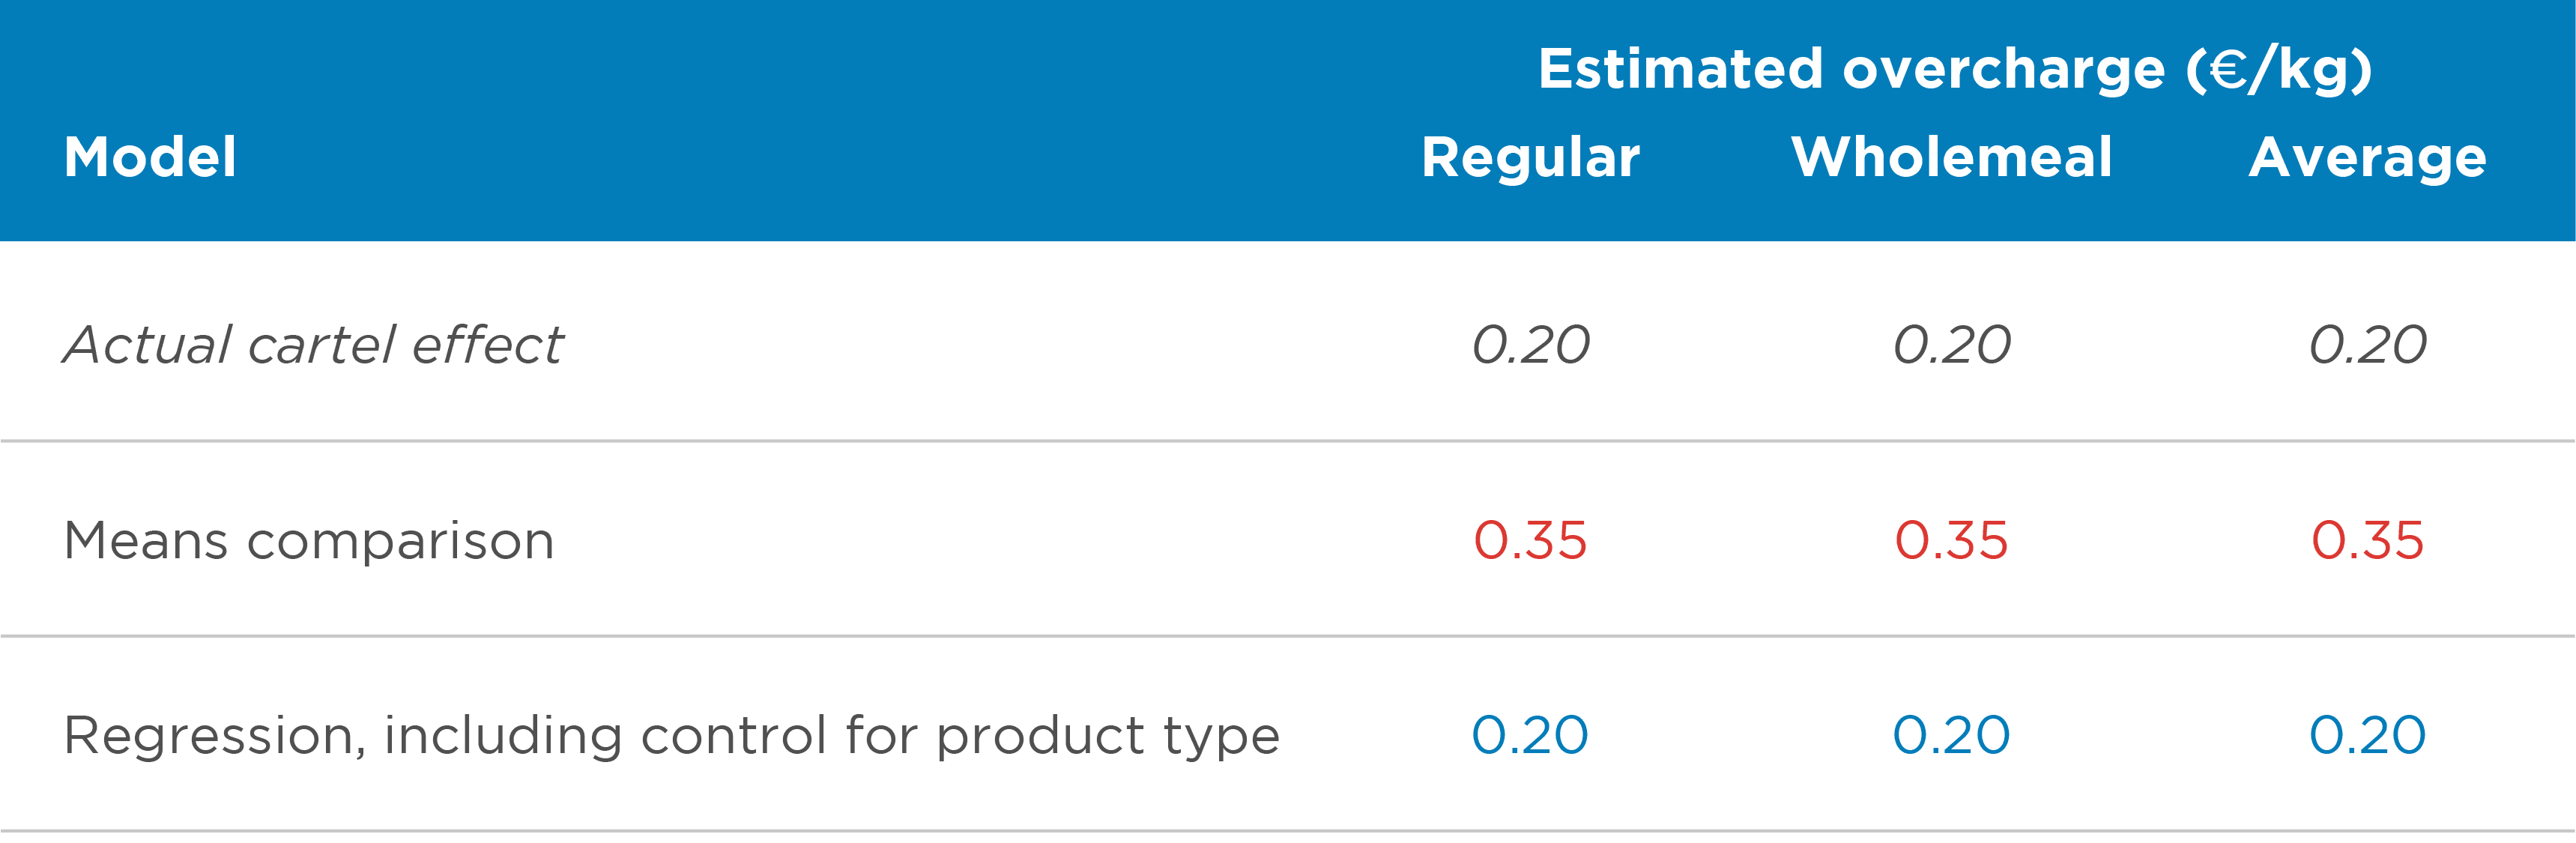
This problem is still surmountable with the standard toolkit by using regression analysis. A regression model will need to control for this change in sample composition so that the estimation does not confound the cartel effect with price differences between regular and wholemeal flour. In this case, it is sufficient to add a control variable that distinguishes regular and wholemeal flour (see Table 1).
Table 1: Estimation results under homogeneous effects – varying sample composition
The issue becomes more challenging when heterogeneous effects are combined with changes in sample composition (Figure 4).
Figure 4: Illustration of means comparison under heterogeneous effects - varying sample composition
In this scenario, there are now two factors which conflate to produce biased overcharge estimates. Firstly, there are heterogeneous effects, which as established above implies that a single estimate will only reflect some weighted average of the overcharge. Secondly, the compositional effects mean that the choice of weights becomes more relevant, because the same weighting that was appropriate during the cartel (50/50) is no longer appropriate after the cartel (80/20).
It turns out that, under the standard toolkit, there is no simple solution to these issues in a model estimating a single effect. A regression model that produced correct estimates in the context of homogeneous effects performs poorly in this case. To start with, the model specification with a single cartel variable for all units does not allow for an estimation of the individual overcharge supported by each customer. Those who bought mainly wholemeal flour would receive compensation that is insufficient to cover the damage suffered.
This might not be a problem if the regression at least correctly estimated an average effect across all customers, as in the example with no composition changes. However, with composition effects, even this is no longer the case. Even when controlling for product characteristics, the regression estimates an average impact of the infringement of €0.15/kg, which does not correspond to the actual average (€0.20/kg, see Table 2).[9] It is biased because the estimation weights the different effects by the total number of observations in the sample and not only by the observations during the cartel period.
Table 2: Estimation results under heterogeneous effects – varying sample composition

In technical terms, an overcharge estimate is an estimate of the effect of a treatment (the cartel) on the treated units (flour purchased during the cartel). This is commonly referred to as the average treatment effect on the treated units (“ATT”). The bias arises because the regression does not actually estimate the ATT. Instead, it conflates it with what the treatment effect would have been for those units that were not treated (“ATU”) – in this case, flour purchased after the end of the cartel.
This result is troubling. We suspect that practitioners have typically ignored heterogeneous treatment effects because they thought they were estimating at least an average effect, or because they conjectured that what they estimated was close to an average. The recent literature shows that there is nothing to guarantee that this conjecture is correct.[10] The estimated effect may well be far away from the average, and there is nothing in the commonly reported regression results that would inform the reader about the likely magnitude and direction of the bias.
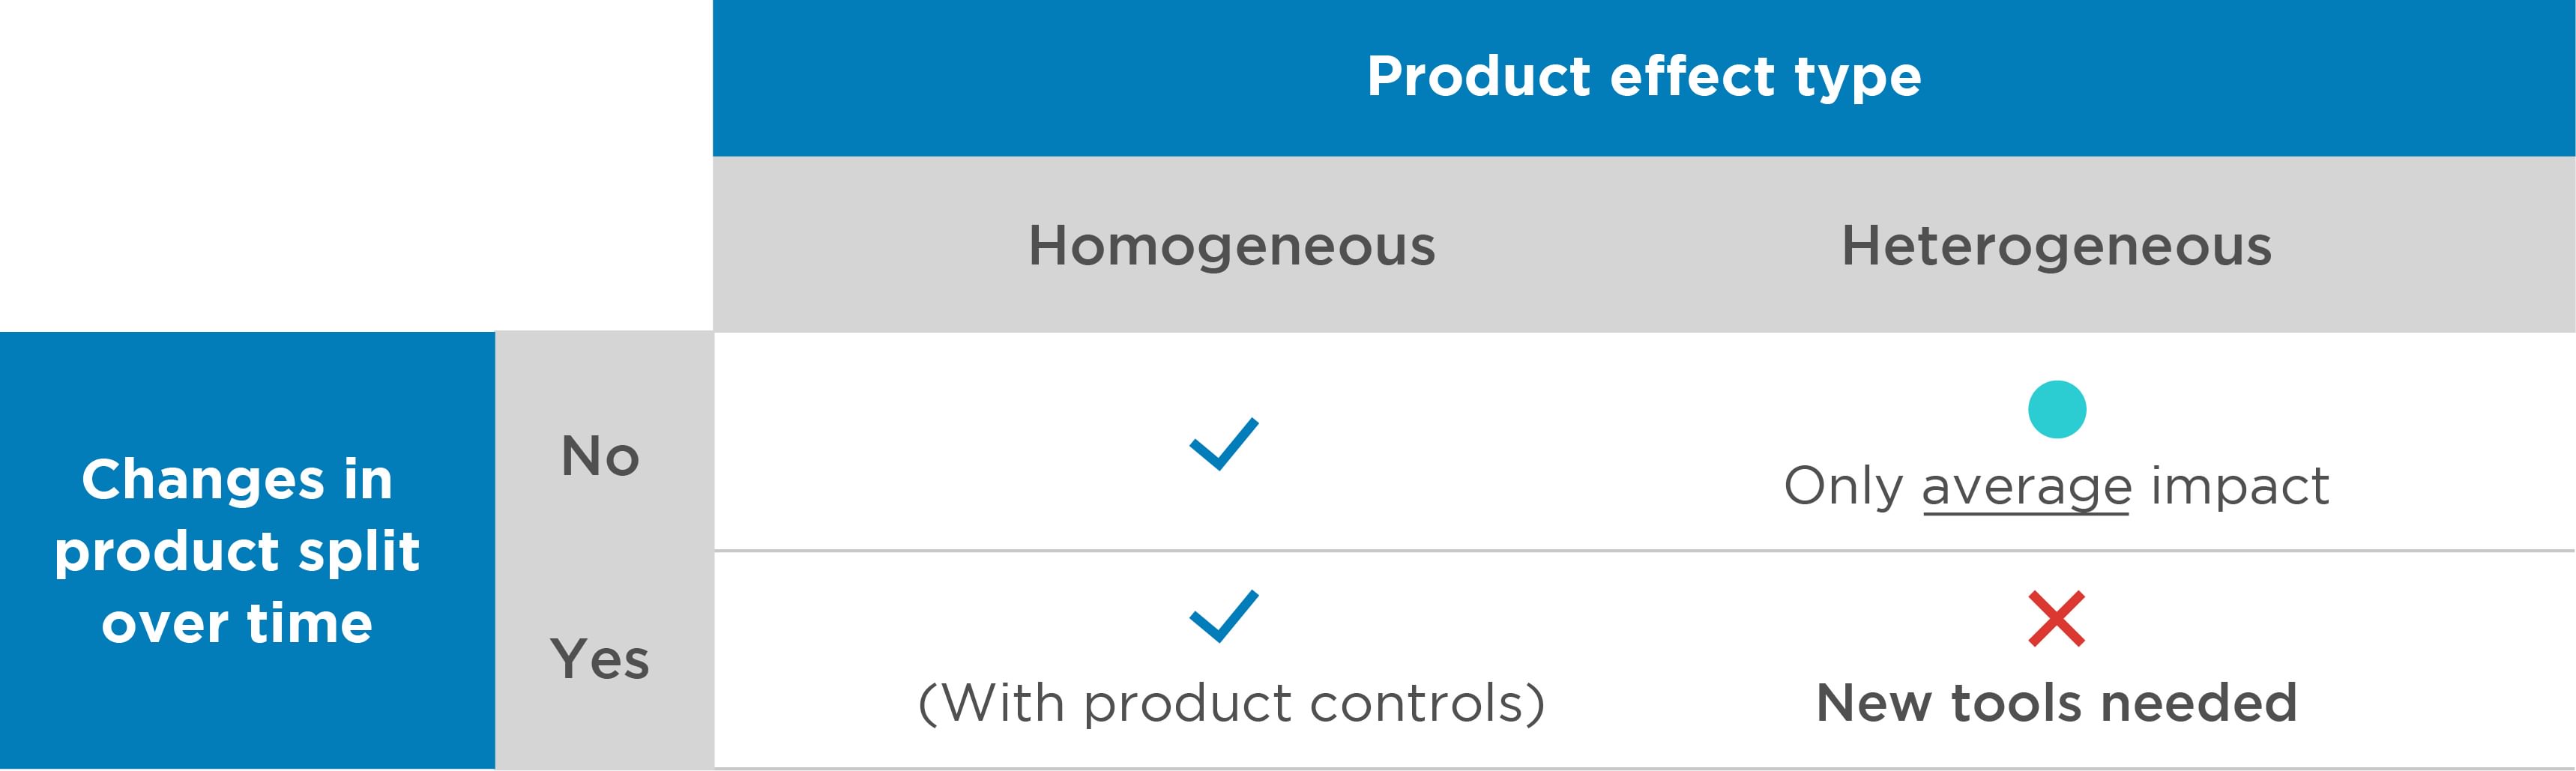
The table below summarises the findings in this section, showing how estimates derived from the standard toolkit can be interpreted depending on the characteristics of the market.
Table 3: How well the standard toolkit performs given different assumptions
Towards a solution: addressing heterogeneous effects
The extended example and the conclusions from the literature are a cautionary note on an approach that is standard in practice. However, they should not be interpreted as excluding any possible econometric analysis to estimate overcharges in damage claims. On the contrary, they call to develop analyses that address this issue.
Building on the regression framework
A useful tool for this purpose has been developed by Słoczynski (2022), who derives a diagnostic number ((ω_0 ) ̂) that, under certain conditions, gives a measure of how prevalent this bias is likely to be in practice, and which is readily available for use in widely used statistical packages.[11] This number is bounded between zero and one and when it is close to zero, the regression estimate of the model using a single cartel variable likely does a good job of approximating the average cartel effect, even in the presence of underlying heterogeneity.[12]
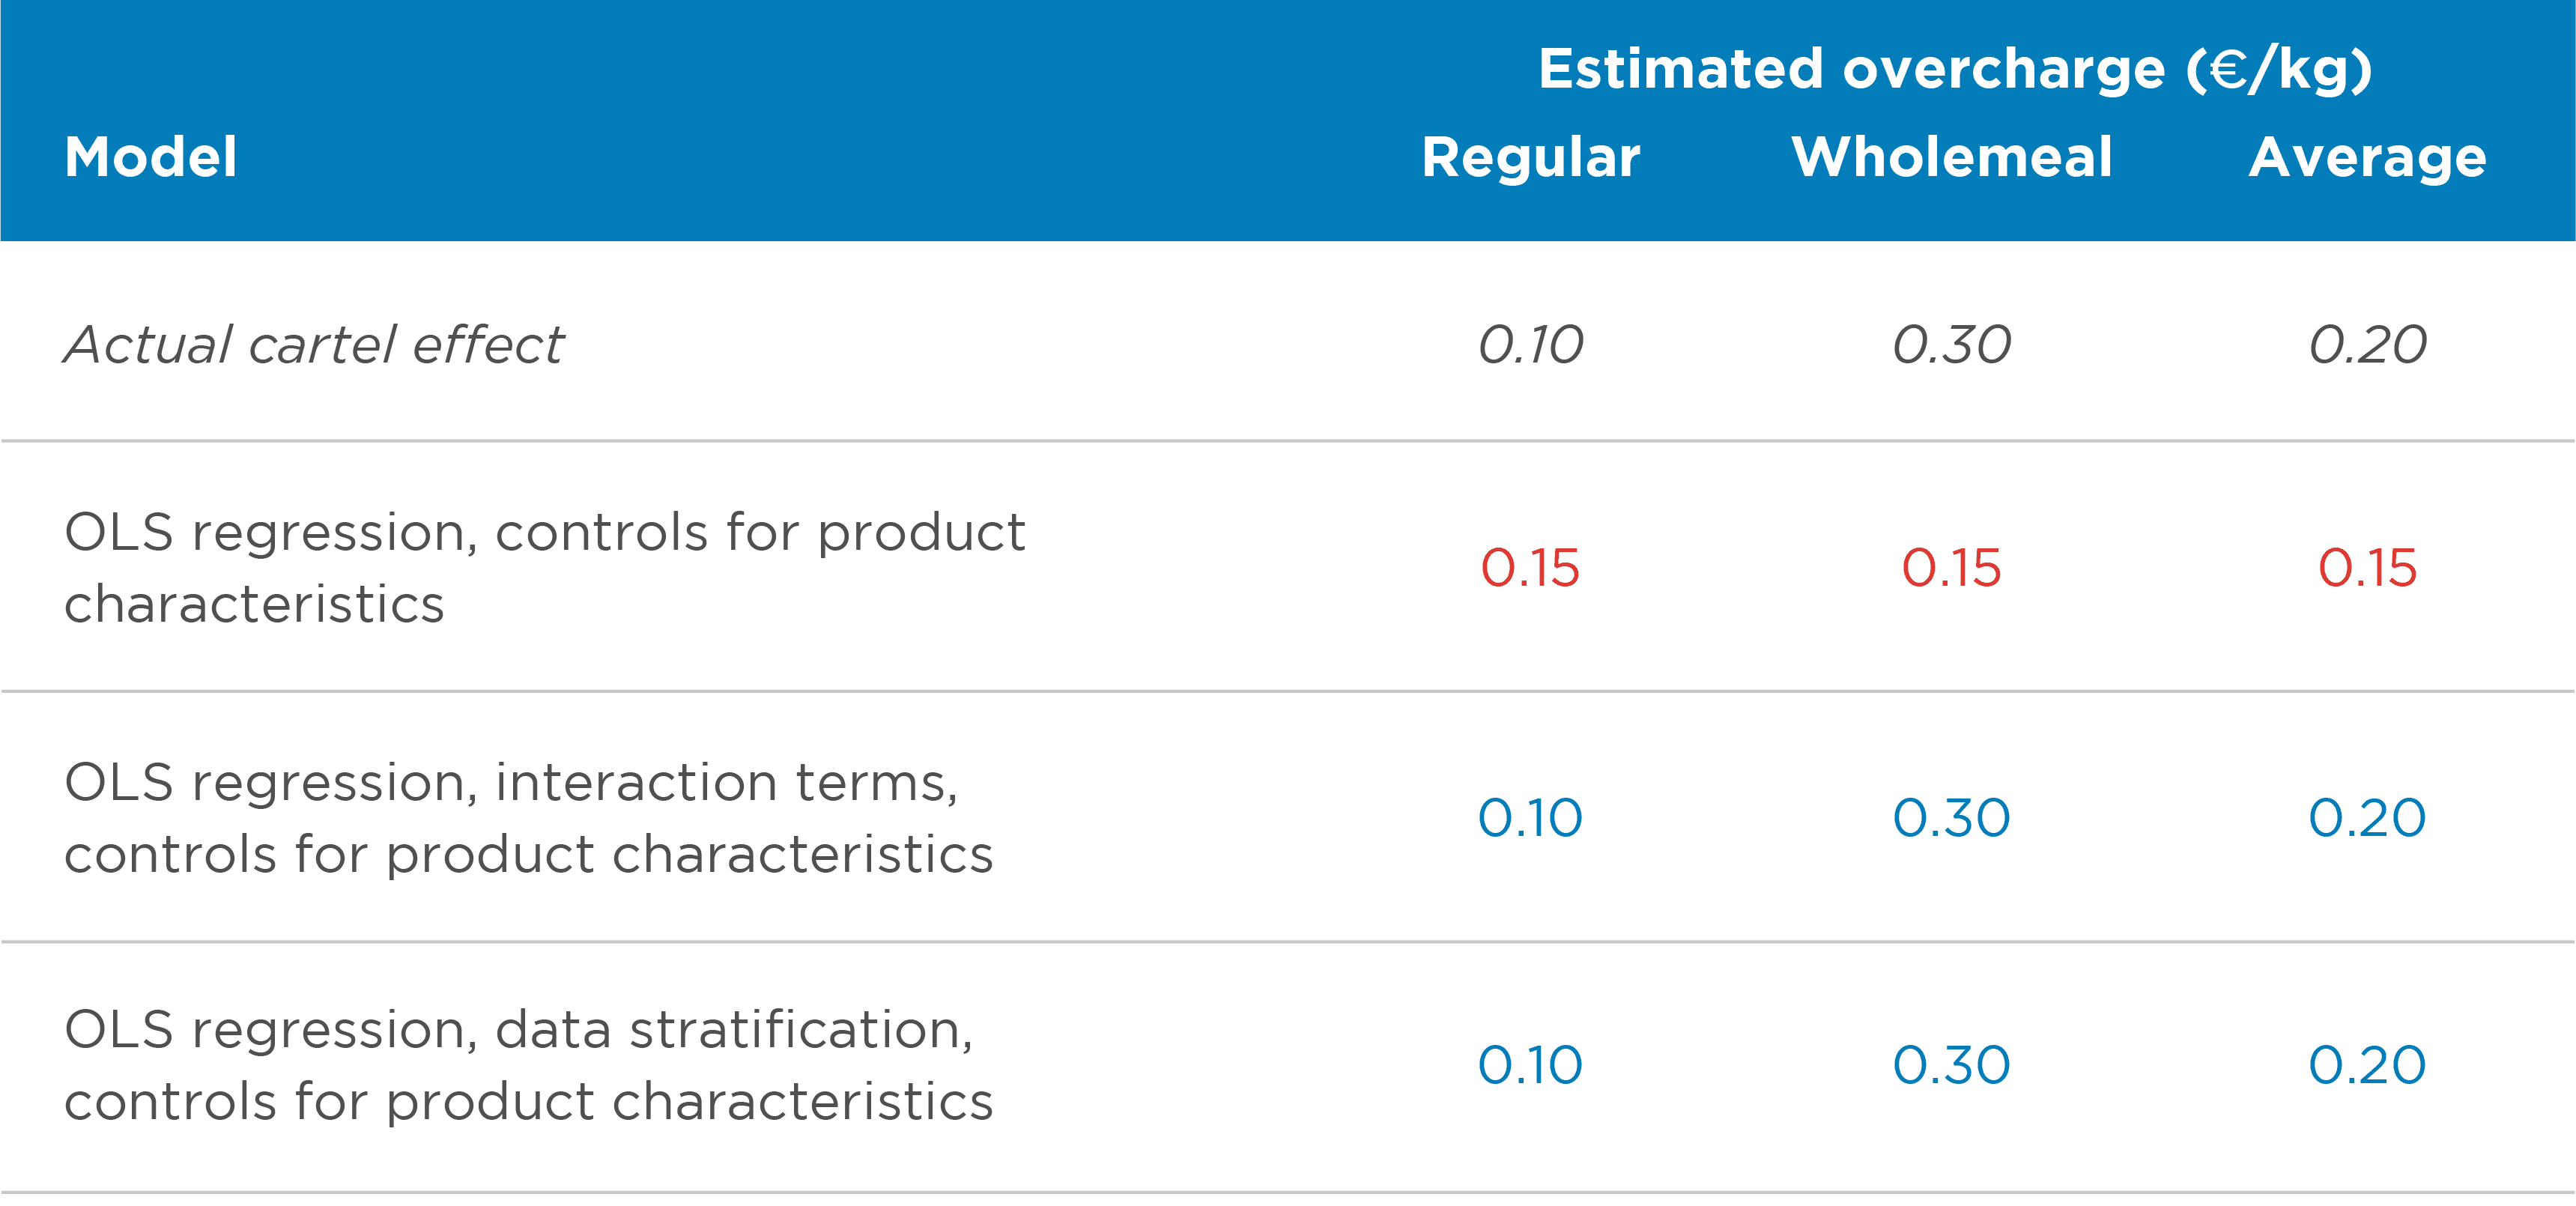
Beyond useful diagnostics, in cases where there is evidence of heterogeneous effects, there are different ways to address them that are simple to implement within a regression framework (Table 4). One way is to adjust the econometric model by adding interaction terms between the cartel variable and the variable over which the heterogeneity occurs. Returning to the flour example, this approach would effectively estimate two overcharges, each corresponding to the different types of flour. Alternatively, heterogeneity can also be accounted for by stratifying the sample by the variable on which there is heterogeneity and estimating the overcharge separately. This would be equivalent to estimating two separate econometric models, each corresponding to the different types of flour.
In the example, both alternatives eliminate this bias and produce identical results. In practice, this may not be the case and one option may be preferable to the other depending on the circumstances. Stratifying the analysis by the dimension of interest is a more flexible option, as it allows for heterogeneity in the estimates of all variables in the model. However, it may also be more inefficient, as it requires larger amounts of data to estimate the parameters in the model, and in models with a large number of control variables, this may be impossible to estimate.
Table 4: Controlling for heterogeneous effects with varying sample composition
These alternatives are effective in that they are easy to implement and provide an unbiased estimate in the presence of heterogeneous effects. However, their weakness is that they require knowledge of the source of heterogeneity. In practice, we might not know the dimensions along which heterogeneity occurs, so we may need to test for heterogeneity along different dimensions.
Further tools outside the regression framework
There are other methods that go beyond standard regression and which may be more suitable for dealing with heterogeneous cartel effects. Several of these methods – for example, regression adjustment, inverse probability weighting or matching estimators [13] – are based on similar assumptions as a standard regression and do estimate the ATT, effectively by weighting the sample in such a way that the estimated ATT is not contaminated by the ATU. As with linear regression, these methods can also be extended to explicitly estimate the extent of heterogeneity – in our example, to produce separate estimates for each type of flour.
More recent alternatives that depart from a traditional regression framework have been developed in the machine learning literature. An example is causal forests. Rather than relying on an explicit regression equation, causal forests use an algorithmic search to identify the dimensions along which the heterogeneity occurs and then estimate the treatment effects with whatever heterogeneity the algorithm detects.[14] They represent a more flexible approach to estimate treatment effects as they do not require the researcher to recognise the relevant dimension of heterogeneity beforehand and accommodate potentially very complex forms of heterogeneity. This approach is particularly useful in real-life settings, where the overcharge could vary in forms beyond that of the simple and symmetric interaction term (such as in our flour example above).[15]
While these techniques are very useful in certain applications, they should not be seen as a silver bullet, nor should regression analysis be disregarded altogether. Causal forests can be costly to implement because of their computation and data requirements and may not be feasible in high-dimensional scenarios, i.e., cases where the estimation requires many control variables. They rely on sensible but important assumptions about the objective function to be optimised and the algorithm used for estimation. As such, it may be sometimes difficult to establish to what extent the results are driven by technical parameters underlying the algorithm.
The complex patterns of heterogeneity that causal forests may detect can also make the output difficult to interpret. Estimation flexibility is an attractive feature, but not all cases justify complex heterogeneity patterns, especially when economic analysis can guide a sensible regression analysis – e.g., a good understanding of the market and the cartel based on industry knowledge and the facts of the case.
Concluding remarks
Over the past decades, quantitative methods have entered the courtroom and economists have made steady progress demonstrating their value to the legal profession. Among these methods, regression analysis continues to play a central role in this context. Meanwhile, academic research has deepened our understanding of its limits when cartel effects are heterogeneous across firms or markets. But that doesn’t make regression analysis any less useful. On the contrary, we now have a clearer sense of when it works best and when it should be refined or combined with other methods. This growing body of work challenges us to sharpen our tools and broaden our approach. To us as econometricians, these are exciting times.
References
-
Daniel Ball is an Economist, Esteban Cattaneo is a Senior Economist, Jasper Haller is a Vice President, and Soledad Pereiras is a Vice President at Compass Lexecon. The views expressed in this article are the views of the authors only and do not necessarily represent the views of Compass Lexecon, its management, its subsidiaries, its affiliates, its employees, or its clients.
-
Directive 2014/104/EU of the European Parliament and of the Council of 26 November 2014 on certain rules governing actions for damages under national law for infringements of the competition law provisions of the Member States and of the European Union Text with EEA relevance. Available here: https://eurlex.europa.eu/legal....
-
For example, in the Copper Plumbing Tubes case, the European Commission found evidence that the cartel was especially effective in particular geographies and for particular product classes. Commission Decision in Case COMP/E-1/38.069 – Copper Plumbing Tubes, paragraph 634. Examples of cases where the Commission found that the effectiveness of the cartel varied over time are: Commission Decision in Case COMP/E-1/38.069 – Copper Plumbing Tubes, paragraph 664; Commission Decision in Case COMP/E-1/37.857 – Organic Peroxides, paragraph 412; Commission Decision in Case COMP/E-1/38.240 – Industrial Tubes, paragraph 210.
-
Potential heterogeneous effects are also relevant in class actions. Class certification relies on establishing some form of “commonality” among the claimants which may be challenged if a cartel impacts different customers or market segments differently. Defendants may argue that the variability in overcharges undermines the cohesiveness of the class and plaintiffs may need to present robust empirical evidence to demonstrate that common issues predominate over individual differences.
-
See, for example, European Commission (2013), ‘Commission Staff Working Document. Practical Guide. Quantifying Harm in Actions for Damages Based on Breaches of Article 101 or 102 of the Treaty on the Functioning of the European Union’; American Bar Association (2010). Proving antitrust damages: Legal and economic issues, p. 180; Davis, P., & Garcés, E. (2009). Quantitative techniques for competition and antitrust analysis. Princeton University Press, p. 356 et seq.; McCrary, J. & Rubinfeld, D.L. (2014). Measuring Benchmark Damages in Antitrust Litigation, Journal of Econometric Methods, 3(1), p. 63–74; and Oxera (2009): Quantifying Antitrust Damages – Towards Non-Binding Guidance for Courts, p. 53.
-
In what follows, we discuss the challenges of assessing heterogeneous treatment effects across different units. Differences in treatment impacts can also emerge over time, for example when a particular treatment is staggered in adoption. This has sparked extensive research in economic literature, particularly in the context of difference-in-difference estimates.
-
Practical Guide, paragraph 32.
-
Such composition changes are plausible and may be related to the cartel (e.g., sale of the cheaper product was restricted by cartelists), unrelated to the cartel (e.g., demand for different product types changing over time), or may occur by chance.
-
Since during the cartel period, sales of regular and wholemeal flour were sold in equal proportions; thus, the average overcharge is 0.5 * €0.10/kg + 0.5 * €0.30/kg = €0.20/kg.
-
Słoczyński, T. (2022). Interpreting OLS estimands when treatment effects are heterogeneous: Smaller groups get larger weights. Review of Economics and Statistics, 104(3), 501-509. This paper shows that the estimates using a single treatment variable in a linear OLS regression can be represented as a complex weighted average of the treatment effects that depend on the distribution of the control variables across units and over time.
-
For example, the R package hettreatreg available at https://CRAN.R-project.org/pac....
-
Intuitively, this diagnostic number shows the proportion of the difference between ATU and ATT that contributes to bias.
-
Matching estimators are based on the comparison of units in the treatment group with units in the non-treated group that share the same characteristics. The average value of the difference between the pairs of treated and untreated units is the estimated effect of the treatment. In some cases, matching may not be operative because we have many characteristics. Methods based on propensity score allow to summarise the information of the characteristics in a single variable: the estimated probability that the unit is treated given its characteristics. The treatment effect is estimated using a weighted regression that reweights the population based the inverse of this probability. Regression adjustment also adapts the sample for estimation to obtain an estimate of the ATT. The method requires estimating separate regressions with the same specification for the treated and untreated units and then calculating the fitted values for the treated units using the estimates from both models. The ATT is the mean difference of the two fitted values.
-
Causal forests use commonly what is called an “honest estimation” (honest causal trees) where the tree structure – that is, the dimensions for heterogeneous treatment effects – is built on a training sample and the leaf estimates – that is, the estimated effects – are taken from an independent estimation sample.
-
To use an unrealistic illustrative example, wholemeal flour might have suffered higher overcharges when sold to organic shops in urban areas during periods of high demand (i.e. wholemeal x organic shop x urban area), whereas regular flour might have suffered different overcharges during periods of high demand, but this high demand might have been defined under different thresholds. A researcher would be highly unlikely to come up with this formulation of heterogeneity based on their knowledge of the market alone.