What your search is telling us: Using search data to assess competition

Share
Written by Antoine Gracia Victoria and Thibaut de Bernard
In this article, the data science team shows that data related to searches correlate with and predict sales and are therefore very helpful for competition analysis.
Search data capture the interests of people in topics and products
We spend a lot of time online. On average 7 hours a day1, which is as much time as we sleep.2
The primary reason for using the internet is to find information3, and people use search engines every day for every question they have.
Data on search queries are therefore instructive of consumers’ interests. To illustrate, let’s have a look at global Google searches related to Meghan Markle, Duchess of Sussex, between 2016 and 2021.4
Figure 1: Google search data related to Meghan Markle, worldwide (2016-2021)
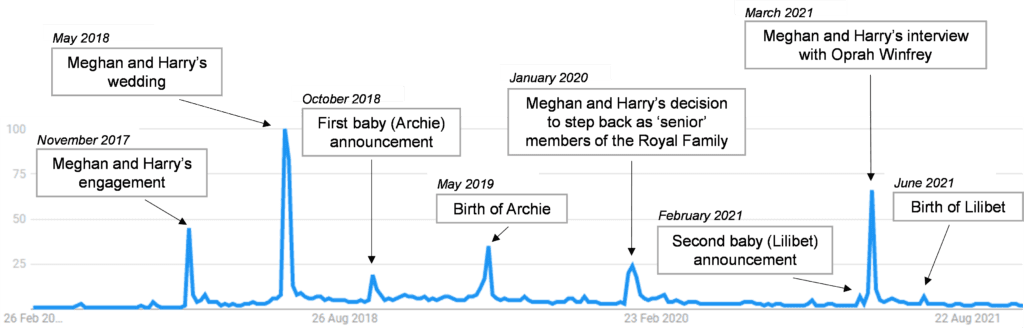
Google searches related to Meghan Markle varied a lot between 2016 and 2021. Meghan and Harry’s wedding in May 2018, as well as their interview with Oprah Winfrey in March 2021, generated a lot of searches on Google. The birth of Archie, their first born, generated quite a lot; that of Lilibet, not so much.
Search data are also informative of what consumers are willing to buy: 81% use search engines when they consider buying a product.5 Searching for information is a part of the customer journey, that is described in the marketing world as a purchase funnel, flowing from awareness to intent and desire, and finally purchase of the product.6
Searches are thus indicative of a likely future purchase. In plain terms, queries on search engines correlate with sales. This finding, evidenced by multiple academic papers,7 is exactly why search data can be valuable to competitive analysis.
Correlation may not be perfect because (a) some products generate a lot of interest irrespective of the purchase (e.g. luxury products like a Ferrari car) and (b) for some products, there can be a huge lag between the search for information and the purchase (e.g. wedding rings). In addition, analysis on search data is better suited for B2C products rather than B2B ones, see section ‘Limitations and tips on Google Trends’.
The easiest way to access search data is Google Trends
The easiest way to access search data is Google Trends.
Google Trends8 is a public tool anyone can use to retrieve data associated with any search (e.g. all queries comprising the word “football”).
Google Trends provides access to anonymized and categorized data:
- Data are available daily, from 2004 until the present day
- Data are available globally, but the user can narrow down into countries or regions
- The user can focus on specific categories (e.g. travel, automotive, food, etc.) and on specific Google search services (news, images, Google shopping, YouTube)
- The user can compare results for multiple searches
- Data can be visualised easily on Google Trends’ website. They are also available for download9
Share of search correlates with market shares
Market shares are a key metric in competition matters. They can be informative of the degree of competition in a market and of the importance of each player in a market.
Similarly to market shares, which are share of sales, we can compute shares of searches.
Share of search is a popular metric in marketing and advertising. Les Binet, who is a leading researcher on marketing effectiveness finds that in three industries (automotive, mobile handsets and energy) share of search (a) correlates with market share (e.g. Nissan has both a 4% share of search and market share) and (b) is a leading indicator (changes in share of search happen before changes in market share), i.e. it can predict the evolution of market shares.10
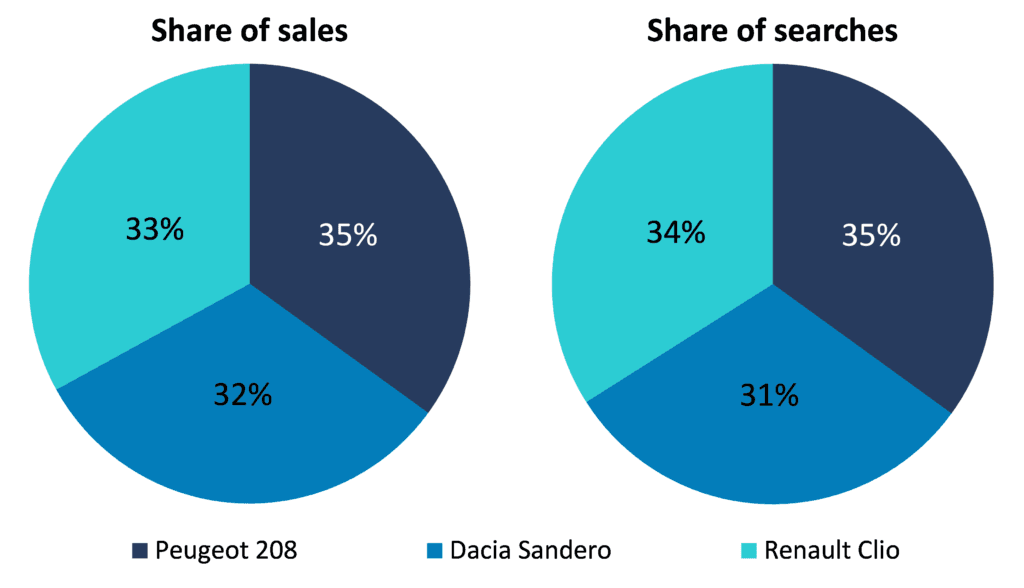
To illustrate Binet’s findings, the figure below shows that the shares of searches of the three most sold cars in France in 2021 match almost perfectly their share of sales.
Figure 2: Share of sales (in units sold) vs shares of search, top 3 sales in automotive in France (2021)
How can search data contribute to the analysis of competition
To our knowledge, search data are not very much used in competition matters.
While we consider that data related to actual choices of consumers (sales, churn, etc.) should remain the primary source of information to assess the competitive landscape and the degree of competition in a market, we think that search data are a useful new ingredient to these analyses, especially when “traditional” data are not available.
Use case 1: preliminary analysis of competition at the regional level
Suppose two retailers are willing to merge and would like to have a sense of the geographical areas where competition concerns could arise.
An in-depth analysis requires having access to their stores’ locations and their competitors’, to define relevant geographic markets (catchment areas) and to compute market shares in each area. Such analysis requires time and data that can be difficult to obtain.
Though this fully-fledged analysis will be required at a later stage of the case, we can use search data early on in the project to provide a sketch of the competitive landscape at the regional level. The approach is to compare search volumes for retailers A and B across different locations.
The following illustrative example compares search data for two fast-food brands, Burger King and Chipotle, in US states over the last 5 years.11
Figure 3: Illustration: Burger King vs Chipotle in the US (2018-2022)
Based on these maps and data, we can identify three categories of states:
- In states like Mississippi, Burger King is much more popular than Chipotle (the former has more than five times as many searches as the latter)
- In states like Minnesota, Chipotle is more popular than Burger King, with around twice as many searches
- In most states, the two brands appear closely popular in terms of searches, e.g. in Nevada and Florida where each brand has approximately the same volume of searches
This suggests that the demand for these two chains of fast foods is not heavily segmented geographically, so that they may be considered as close competitors in several states.
What if we add known competitors to the analysis?
Figure 4: Illustration: Burger King vs Chipotle and a set of competitors in the US (2018-2022)
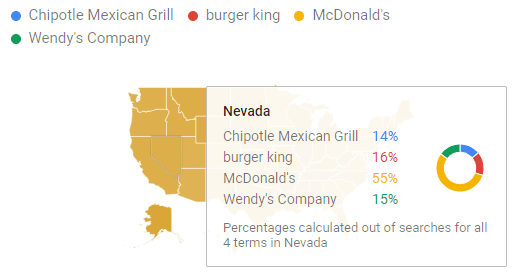
These data show us that there are other big fast-food brands in these states (Mc Donald’s and Wendy’s). These brands are likely to exert quite an intense competitive pressure on Chipotle and Burger King. Assessing the biggest players in terms of searches can also save time when collecting data, by focusing on players which hold the biggest share of search.
Use case 2: detect the potential impact of a new disruptive product
Search data can also be used to detect “weak signals” of potential competition. This can be helpful for predicting how much a near-launched disruptive product is likely to affect the market dynamics.
Market share data are not a very powerful asset to discuss this sort of market change, as they are often yearly data (maybe quarterly, but in any event not daily) over the past three to five years.
If we take the DeLorean12 back to January 2007, how could we have predicted the impact that the first iPhone was about to have in the market for mobile handsets?
At that time, the iPhone would have had a 0% market share. Yet, search data would have shown a tremendous interest, especially in Steve Jobs’ keynote speech in early January 2007 to present this new product. The comparison with the Nokia N95, which was supposed to be an “iPhone killer”, is striking.13
Figure 5: Illustration: search data on the iPhone 1 and Nokia N95, globally (2006-2007)
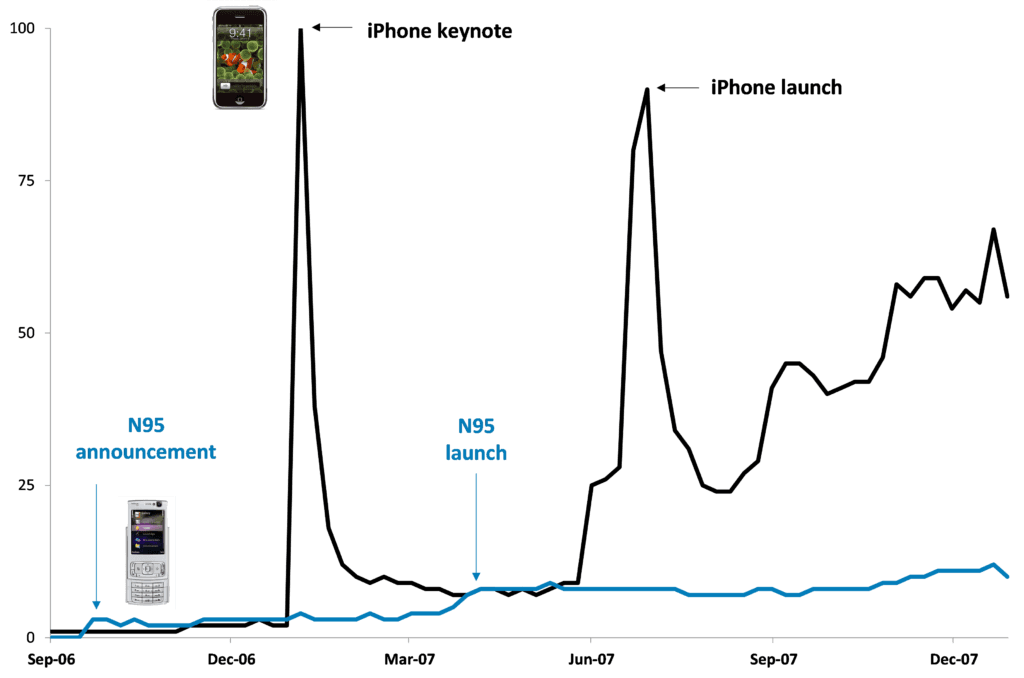
The first iPhone generated a much bigger interest than the Nokia N95, both when it was announced and when it was launched. In 2007, Apple sold 6 million iPhones (launched in June 2007) while Nokia sold 10 million units of the N95 (launched in March 2007).14 In 2008, Apple sold 25 million units of the iPhone 3G, more than any other Nokia phones (15 million units for their best seller that year).15 In 2011, Apple took Nokia’s number one slot for smartphone sales.
Conclusion
As René Magritte could have said, “This is not a data science”. This article is not about complex algorithms. It is about a set of public and very granular data, that are indicative of consumers’ preferences and decision making. As economic consultants, our job is to present robust and compelling arguments - search data provide a trove of information to help us achieve this.
Limitations and tips on Google Trends
- Google is not the only search engine. Although many of us use Google daily, some people may prefer other search engines (e.g. people who are very privacy conscious are more likely to use DuckDuckGo).
- There must be enough searches on a specific product in the selected timeframe and geography. Even though this is most often the case, there may not be enough datapoints if one is looking for a very new niche product. More generally, it also implies that analysis performed on search data works better on products that customers search for information about. Typically, B2C products are likely to be better suited to this type of analysis than B2B products and services.
- The choice of the terms is not always straightforward. Think about Orange, the French telecom incumbent. If you search for the term ‘Orange’, corresponding searches will relate to the telecom provider, but also to the colour orange.
Google Trends helps to a certain extent to overcome this challenge, by suggesting several categories to which a given term could correspond to (for the term ‘orange’, Google Trends suggests the following categories: the firm Orange, the orange fruit or the orange juice drink).
Google also provides tips on how to phrase your query (for instance, tennis shoe will give all searches containing “tennis” and “shoe” in any order, while “tennis shoe” will give all searches containing the exact chain of words in quotation marks).16
In addition to these tips, in case the query is not completely straightforward, our recommendation is to test different variations of queries and pressure test those with business sense and other data that might be available. All these tips help to reduce the sensitivity of the analysis – that is, the risk that two people running the same search analysis would end up with different results. - Google Trends does not directly provide the number of searches associated with a given term. Search data are indexed and normalized. “Indexed” means that each data point is divided by the total searches of the geography and time range it represents to compare relative popularity. “Normalized” means that 100 is the maximum search interest for the time and location selected. The simple consequence is that comparing terms or topics will show their relative popularity, not the exact volume of searches associated with these terms.17
About the Data Science Team
The Compass Lexecon Data Science team was created to bring the latest developments in programming, machine learning and data analysis to economic consulting.
Sometimes this involves applying novel techniques to assess specific questions in an innovative and compelling way. For instance, running a sentiment analysis on social media content related to merging firms can be informative on their closeness of competition, and can supplement the results of a survey.
Other times it is about making work faster, more accurate, and more efficient, especially on cases which involve large datasets.
This short article is the part of a series of articles showcasing how data science can lead to more streamlined and robust economic analysis and ultimately to better decisions in competition cases. If you would like to find out more, please do not hesitate to reach out to us at datascience@compasslexecon.com.
1 Datareportal, Digital 2021 October Global Statshot Report, https://datareportal.com/reports/digital-2021-october-global-statshot (slide 10).
2 World Economic Forum, 16 August 2019, Are you sleeping enough? This infographic shows how you compare to the rest of the World, https://www.weforum.org/agenda/2019/08/we-need-more-sleep
3 Datareportal, Digital 2021 October Global Statshot Report, https://datareportal.com/reports/digital-2021-october-global-statshot (slide 23).
4 For other examples of searches capturing internet users’ interest, see for instance The Washington Post, Which US States over/under perform on search interest relative to population?, https://www.washingtonpost.com/news/wonk/wp/2016/04/05/the-most-interesting-states-in-america-according-to-google/ and The Huffington Post, Interest In 'Gun Control' Is Fading, Google Data Shows, https://www.huffpost.com/entry/gun-control-trends_n_561bdd16e4b0082030a34030.
5 Share of Search Council, https://www.myshareofsearch.com/.
6 E. K. Strong, Jr. The Psychology of Selling and Advertising. New York 1925, p. 349 and p. 9. Where in the purchase funnel people are when they make searches is a big topic in marketing and advertising, that we do not cover in this article.
7 For academic papers analysing Google Trends, see for instance: Choi S., Varian H., Predicting the Present with Google Trends ; Jun S.P., H. Sun Yoon, Choi S., Ten years of research change using Google Trends: From the perspective of big data utilizations and applications, Technology Forecasting and Social Change, Volume 130, May 2018, https://doi.org/10.1016/j.techfore.2017.11.009 ; Preis, T., Moat, H. & Stanley, H. Quantifying Trading Behaviours in Financial Markets Using Google Trends. Sci Rep 3, 1684 (2013). https://doi.org/10.1038/srep01684
8 https://trends.google.com
9 The last section of this article goes through some limitations of Google Trends and provides some tips on how to use this tool.
10 IPA, Binet presents fast, cheap, predictive Share of Search metric, https://ipa.co.uk/news/binet-presents-fast-cheap-predictive-share-of-search-metric.The correlation between searches and market shares is also verified in other sectors, including retail, see for instance https://croftanalytics.com/f/on-the-link-between-search-and-sales-for-grocery-retailers.
11 Google Trends data are also available for metropolitan areas.
12 https://en.wikipedia.org/wiki/DeLorean_time_machine
13 The Conversation, Nokia had the world’s best smartphone – then came the ‘inferior’ iPhone, https://theconversation.com/nokia-had-the-worlds-best-smartphone-then-came-the-inferior-iphone-70958.
14 Wikiwand, List of best-selling mobile phones, https://www.wikiwand.com/en/List_of_best-selling_mobile_phones#/2008
15 https://en.wikipedia.org/wiki/List_of_best-selling_mobile_phones#2008
16 Google, Trends help, https://support.google.com/trends/answer/4359550.
17 Google News Lab, What is Google Trends data — and what does it mean?, https://medium.com/google-news-lab/what-is-google-trends-data-and-what-does-it-mean-b48f07342ee8.
Related insights
-

Article • 02 Mar 2022
Data Visualisation: Crossing the line
-
Article • 01 Feb 2022
Game, Set and Fuzzy match