


Validating that royalties inferred from “comparable” SEP licences are FRAND

Share
When courts or arbitrators determine the fair, reasonable, and non-discriminatory (FRAND) royalty for a disputed standard essential patent (SEP) licence, they often prefer to do so informed by “comparable contracts” – that is, the prices that parties agreed for similar licences in similar situations. Pekka Sääskilahti and Andrew Tuffin [1] explore how inference based on comparable contracts can be improved by using a “cross-check” – comparing the price proposed for the licence with the benefits it provides. They also discuss the strengths and weaknesses of the most commonly used cross-checks.
View the PDF version of this article.
The views expressed in this article are the views of the authors only and do not necessarily represent the views of Compass Lexecon, its management, its subsidiaries, its affiliates, its employees or its clients.
Introduction
When courts or arbitrators are asked to determine the fair, reasonable, and non-discriminatory (FRAND) royalty for a disputed standard essential patent (SEP) licence, often they prefer to do so informed by the terms and conditions agreed in “comparable contracts” – that is, the prices that similar parties agreed for similar licences in similar situations.[2]
In principle, there is good reason for this. Analysing comparable contracts should reveal the “going rate” that market participants agreed was reasonable for licences in their specific circumstances. That rate, therefore, should indicate what the market would consider FRAND for a disputed licence in similar circumstances.
However, when applied in practice, inferring a FRAND price from potentially comparable SEP contracts involves challenges for courts to address. Estimates put forward by opposing parties may be far apart from each other, despite both being derived from prices in contracts that the parties argue are comparable. Courts might also find it challenging to determine the extent to which contracts supporting either of the estimated FRAND rates are comparable, or whether any adjustments made to improve their comparability are appropriate. Courts may have an additional concern; that the prices other parties agreed for potentially comparable SEP licences might not be FRAND in the first place, undermining the rationale for inferring prices from them. Nonetheless, a court may feel constrained; if it rejects the analysis, the court may be left with little else to guide its determination of what is reasonable.[3]
Broadly, there are two ways that courts can overcome these challenges, such that they can benefit from the strength of a comparables approach while mitigating its challenges. The first is to interrogate the process that led to each estimate, to determine which is more reliable. The second is to interrogate the outcomes that each estimate would lead to, to determine which is fairer and more reasonable. In this article, we explore that second approach.
The FRAND commitment seeks an outcome that, on the one hand, incentivises and rewards firms who develop foundational technologies that benefit consumers and, on the other, ensures that those technologies are available to implementers on terms that incentivise them to apply the technologies where consumers value the functionalities they enable. It is hard, if not impossible, to evaluate those incentives when analysing the price of a licence in isolation from the benefits that depend on implementing the licensed technology. However, if courts can compare the prices that parties propose for a licence with a benchmark of the benefits that the licensed technology enables, then they can discriminate between the two.
Here, we assess the merits of three potential benchmarks. The first candidate is common, but hopeless: the price of the product that implements the licensed technology. It tells us nothing about the value of the benefits that are created when implementing the licensed technology.
However, informative benchmarks are available to courts.
- The licensed technologies’ “price premium” can provide a useful benchmark for the benefits that the technology enables, but it is a restrictive one. It indicates the benefit to implementers, in that it shows the incremental price per unit that depends on the inclusion of the licensed technology in the product.
- The ideal benchmark is provided by a “present value added” (PVA) analysis. It isolates the value of the benefits that licensed technology “adds” to a product for all parties: licensors, implementers, and consumers. Importantly, this benchmark recognises that those benefits depend jointly on the contributions of licensors and implementers, both of which the FRAND commitment seeks to incentivise. A PVA analysis shows the scale of those benefits and, for a given proposal of FRAND, the extent to which each party takes a share of them.
A benchmark that makes transparent the benefits that depend on licensed technology helps the court resolve FRAND disputes. It allows the court to evaluate how the prices proposed for a licence would reward each party for its contribution to creating those benefits. It can then discriminate between rival proposals, choosing the one that better supports the objective of the FRAND commitment.
The strength of the comparables approach, and its challenges
Inferring the price of an asset from the prices agreed for similar assets is a common valuation technique used in many situations and industries. House prices are normally estimated this way, even though each house is unique. First, one identifies houses with similar characteristics; then, one establishes the prices paid for them; and, if necessary, one adjusts those prices to account for material differences with the house being valued.
The nature of licensing intellectual property differs from buying or renting physical property – a licensee buys a patent holder’s agreement not to enforce its rights against the licensee for the licence term. However, when one applies the comparables approach to SEPs, the process of inferring a price from similar licences has the same three conceptual steps:
- Identifying closely comparable agreements with similar characteristics and circumstances;
- Establishing the prices agreed for these closely comparable agreements; and
- Inferring an equivalent price for the disputed licence, adjusting for relevant differences where possible and reliable.
However, when analysing comparable contracts for SEP licences, all three steps can be significantly more challenging, which introduces the risk of error and subjectivity.
- Few closely comparable contracts. SEP licences are complex, with many conditions and circumstances that affect their market value and may not closely resemble those of the disputed licence. For instance, the scope of technologies covered, the products covered, the contract term, and many other potentially important “dimensions” can vary to a great extent from contract to contract. On top of this, SEP licences tend to be scarce. As a result, in various SEP cases the courts have struggled to identify close comparables that they can infer a reliable price from. In some circumstances, the court might conclude that no similar contracts are available.[4] Even when it believes that comparable agreements exist, they may not qualify as sufficiently close comparisons.[5]
- Payment terms that are hard to compare. When analysing transactions for comparable physical assets, it is normally straightforward to compare the prices that different parties agreed to. For instance, when comparing house prices most parties agree a one-off cash payment. Even if one needs to adjust those prices into real terms and a common currency, the adjustments are relatively simple. In contrast, the payment terms agreed for SEP licences often vary to a great extent, which makes it hard to establish the comparable cash-equivalent prices that parties agreed for each contract. In particular, in his decision on Apple v Optis, Justice Smith identified the need to “unpack” three common differences: (a) royalty structures – as some parties agree lump-sum payments, while others agree unit rates of various types; (b) the cash-equivalent value of cross-licences (or other payments in kind); and (c) the fact that many agreements cover past release and future sales to different extents, without distinguishing between the two in terms of separate payments. Justice Smith accepted the necessity of “unpacking”, but noted the “subjectivity” it introduces.[6]
- Material differences between closely comparable contracts and the disputed contract that cannot be reliably adjusted for. Even the closest comparable licence can differ from the disputed licence to the extent that the price agreed for it would not be FRAND for the disputed contract. For instance, in his decision on IDG v Lenovo, Justice Mellor decreased the royalty agreed for the closest comparable licence by about 27% to account for the difference in sales mix between that licensee and Lenovo, which he considered a relevant and material difference between the disputed contract and the closest comparable agreement.[7] In principle, if one knew how each difference affects the market price for a licence, then all contracts could be adjusted no matter how (un)comparable they were to the disputed contract before making the adjustments – all the prices agreed for other contracts would converge on the same estimate, once they are adjusted to reflect the disputed contract’s specific circumstances. In practice, however, that is rarely, if at all, possible. Not all differences can be reliably adjusted for, particularly large and material ones, and attempting to adjust all contracts, regardless of the scale and nature of their differences with the disputed licence, risks creating a “Frankenstein” contract – a combination of adjusted contract terms that no real-world negotiation has ever agreed to. Adjustments are possible, but only in restricted circumstances: where the contracts are closely comparable to start with, such that the gap being bridged is small, and the relationship between circumstances and price is quantifiable and reasonably well-understood.
In addition to these analytical challenges, courts and arbitrators in SEP disputes face another problem: the prices agreed for potentially comparable contracts might not be FRAND in the first place.[8]
Normally, one assumes that market prices are fair and reasonable by nature. But that assumption depends on the fact that two parties freely agreed on a price in favour of alternatives. In the case of global standards, that assumption often fails; in those cases, for both sides, there is no alternative to an SEP licence. Licensees cannot use competitive tension between rival licensors to apply downward pressure on the price of a licence – as a potential tenant might do when they negotiate with rival landlords. Neither can licensors use the competitive tension between licensees to sell to the highest bidder – as a landlord would do when negotiating with rival tenants.
In principle, each side of the negotiation has the option to go to court if negotiation breaks down. But, even for parties with the resources to sustain legal proceedings, there is a potential problem. If the courts settle disputes by reference to contracts agreed by parties in the same predicament, then those rates will not be “market rates” in the way that rental prices and house prices are market rates. They have all been agreed in “the shadow of litigation” whether the parties went to court or not. In essence, the prices that parties agreed will be informed by the prices they expected courts to impose should their negotiation break down. They will not be informed by the value of the benefits enabled by implementing the patented technology itself.
For these reasons, parties often submit estimates of FRAND that are far apart. Partly, that is because the practical and principled difficulties create a lot of scope for good faith disagreements. And partly, those difficulties also create scope for manipulation and bias. Parties can legitimately or self-servingly disagree which contracts are comparable, how differences in payment terms can be controlled for, and how material differences in circumstances can be adjusted for. They can also disagree about the degree of alleged hold up or hold out that may affect the comparable contracts. All these disagreements can be seen in IDG v Lenovo and Optis v Apple. However, they are not symptoms of the idiosyncratic aspects of those disputes. They are caused by the inherent uncertainties that analysing potentially comparable SEP contracts involves.
Why it helps to have a benchmark that reflects the benefits that depend on implementing licensed technology
Courts can address the challenges that occur when using comparable contracts in two ways.
The first is to review the process that led to the prices inferred from potentially comparable contracts. The court can discriminate between rival estimates if it can determine in what ways the contracts that support each estimate are comparable to the disputed licence; to what extent they are comparable; and whether the meaningful differences that remain can be reliably adjusted for. For instance, both judgments – IDG v Lenovo and Optis v Apple – detail how the respective judges sought to do this, interrogating each party’s rationale for selecting some contracts as comparable and rejecting others; and adjusting prices for differences in payment structure and circumstances.
The second is to review whether the outcomes that imposing a price inferred from potentially comparable contracts would lead to are reasonable.
To evaluate the potential outcomes of an agreement, we need to first consider the purpose of FRAND. The FRAND commitment has a clear policy objective: to promote incentives for innovators and implementers of standardised technology – for instance, as stated by the ETSI IPR policy.[9] That does not mean that innovators and implementers should be equally rewarded for the value that the depends on their contributions. Rather, it means their incentives to contribute should be balanced. For innovators, it means providing them incentives to invest in developing technologies that benefit the producers and consumers of standardised products, and to make the best of those ideas available through standards. For implementers, it means incentivising them to invest in implementing standardised technologies in ways that benefit consumers, and to bring those products to market.
Whether those two objectives are met depends on the relationship between the price of a license agreement and the value of the benefits that implementing the licensed technology creates.
At a minimum, that price needs to allow both licensors and licensees to participate. A reasonable price should never exceed the value of the benefits it provides; if it did, no one would freely agree to buy it. And neither should the expected price of technology fall below the expected cost of developing it, as no firm would then invest in it in the first place.
Incentives must also be compatible. The benefits that implementing standardised technology provides depend on the efforts of both licensors and implementers: the functionality that a product provides relies on the licensed technology that enables it; and the benefits of the functionality that licensed technology enables also depend on the type of product that implements it. If one side is under-rewarded for its contribution, both sides lose out in the long run as each relies on the other having incentives to contribute.
The problem with assessing prices in isolation is that one cannot be sure how prices reflect the benefits created by the implemented technology. However, if one has a benchmark that indicates the value of those benefits, then it is possible to see how the price of the licence compares: it would show the extent to which licensors are rewarded for developing the technology and making it available through standards; it would show the extent to which licensees are rewarded for implementing those technologies; and it would show the extent to which consumers benefit from the implementation of the technology in products.
Note that the type of benchmark that we describe here is not an alternative estimate of FRAND. That type of “cross-check” provides a separate and independent estimate of what constitutes a FRAND price. Of course, using independent estimates to “triangulate” a FRAND rate can be useful too, but we propose a benchmark that is different in its nature and purpose.
By comparing the price proposed for a licence to the benefits that the licensed technology enables, one can evaluate that price to determine how well it supports the objectives of the FRAND commitment. It makes transparent how the party that puts forward that price proposes to split the benefits of implementing the licensed technology. The more skewed the rewards (and thus incentives) created by their proposal, the greater the burden should be on that party to justify to the court why that imbalance is fair and reasonable.
So, what can one use as a benchmark for the benefits licensed technology creates? Below, we assess the merits of three candidates:
- product prices,
- the licensed technology’s “price premium”, and
- the value that the licensed technology adds to a product market for all parties: IP holders, implementers, and consumers.
Benchmark 1: Why the price of an implementer’s product is uninformative
The first potential benchmark we might compare with a royalty is the price of the product that implements the patented technology. Unfortunately, this option is hopeless as a standalone benchmark; it neither indicates how the licensed technology has contributed to that price – which is captured by the “price premium” and is discussed in the next section – nor does it indicate the total benefit that the licensed technology provides for implementers or their customers.
To see why, compare a hypothetical aggregate royalty rate of $25 for all patents essential to 5G with the price of three products that implement the relevant technologies:
- a multimode 5G chipset, priced at $25;
- a 5G smartphone, priced at $250; and
- a car with 5G, priced at $25,000.
The aggregate royalty appears ludicrous against the price of the chipset; it is 100% of the manufacturer’s revenue, far exceeding its profit margin. In contrast, the same royalty seems more reasonable when framed as 10% of the price of a smartphone, and it may seem trivial when presented as 0.1% of the price of the car.
However, in fact, all these comparisons are bogus. It is possible that $25 is a reasonable royalty for all or none of these products. But comparison with the price of an unlicensed product that already implements the relevant technology cannot tell us either way.
In essence, there are three problems:
- The “anchoring” problem: there is no predictable relationship between the total price of the product that implements the licensed technology and the specific benefits that technology enables. A high product price could depend on implementing the licensed technology, or be largely unrelated to it – if, for instance, the price reflects other valuable characteristics that the product has. Nonetheless, the price of the product skews our thinking about the price of the licence. As noted by Justice Smith in Apple v Optis, “the problem is one of anchoring, and it seems to me that instinctive reactions that a price is “too high” or “too low” or “just right” are impossible to defend rationally.”[10]
- Product prices could adjust to reflect FRAND royalties, as they do for other costs. This problem is clearest when considering the price of an unlicensed chipset, and it is the main flaw with what is known as “the Smallest Saleable Patent Practising Unit” (SSPPU) – a discredited method proposed to determine a maximum price for a licence agreement.[11] The price or profits of an unlicensed chipset do not impose a cap on the price that chipset manufacturers could afford to pay for a licence. If all chipset manufacturers had to pay $25 for a licence, they would not sacrifice the profit they earn from unlicensed chipsets. They would increase prices to reflect the benefit that the licensed technology provides, to the extent that they are able to pass on the cost to their customers. A phone manufacturer that would pay $25 for an unlicensed chipset and $25 to license the technology that chipset implements would also pay $50 for the two combined; it makes no difference whether it makes a single payment or two unbundled payments, the total price and benefits are the same.
- Product prices also reflect demand for other features, unrelated to the benefits of a licence. Clearly, 5G technology enables functionality in phones and cars that attracts consumers, increasing the demand, price, and sales for each product. But so do many other features those products offer. Those features also enable manufacturers to charge higher prices and earn greater profits, but many of them have nothing to do with 5G technology. For example, the impact that waterproofing has on phone prices, or power steering has on car prices, have nothing to do with the benefits provided by a licence for cellular technology.
That product prices are an irrelevant cross-check for royalties should not be confused with ad valorem royalties, which express a royalty rate as a percentage of the implementing product’s price so that it can vary with prices once a reasonable and typical royalty amount is established. In other words, an ad valorem rate does not determine the size of the royalty. Rather, it ensures that, whatever royalty is agreed for the average product, royalties scale relative to that average rate in proportion to the variation in product prices.
Benchmark 2: Why a price premium can be informative of the benefit to licensees
The second potential benchmark we can compare a royalty with is a “price premium” – the proportion of a product’s price that depends on the functionality enabled by the licensed technology.
The price premium is conceptually important. It is not simply the price difference between phones that have 5G (for example) and phones that do not. It is the price difference that we observe between otherwise identical phones, holding all characteristics that affect price other than 5G equal – such as brand, memory, processor speed, screen size, and so forth.
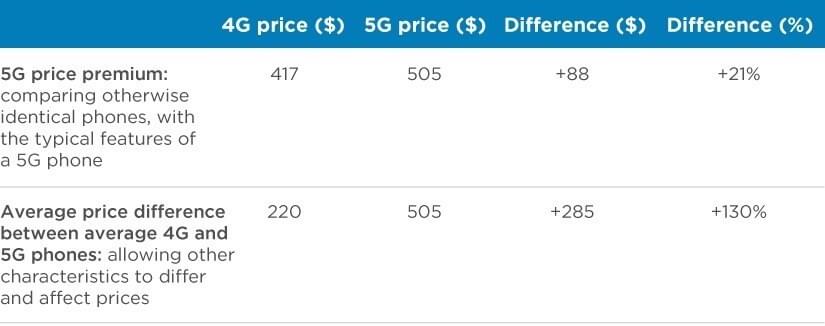
To illustrate, compare the difference between (a) the 5G price premium with (b) the price difference between the average phone with 5G and the average phone that does not offer 5G (Table 1). The latter is considerably larger, 130% against 21%, because the characteristics of the average phone with 5G differ in other respects that also increase its price. The price premium controls for these differences. Other than the presence of 5G, all other characteristics are the same. So, the difference in price relies on the presence of 5G.
Table 1: The 5G price premium and the average price difference between 4G and 5G phones presented in IDG v Lenovo
We can measure a price premium using one of two conventional methods.
- Product matching (or “pair wise comparisons”). Matching simply identifies pairs of products that have identical features and circumstances, except for the patented technology in question. To illustrate, consider the following example. In 2020, consumers could buy a new Samsung Galaxy A51 with 4G for $399. Alternatively, they could choose to buy a Samsung Galaxy A51 with 5G for $500, $101 (25%) more than its 4G equivalent. In (almost) every respect other than the generation of cellular technology, the two models of phone were the same.[12] So, the price difference must be explained (almost) entirely by the fact that one model offered 5G and the cheaper phone did not.
- Hedonic regression. Regression is a standard econometric technique that uses information on characteristics to identify relationships between them. Hedonic regression refers to a particular use of regression used to estimate the impact that a product’s various attributes have on its price.[13] The principle is simple. Each product is viewed as a bundle of the features it offers, each of which contributes to how well it attracts consumers and the price it commands. By comparing the prices that different combinations of characteristics command, one can build a model that reveals the contribution that each characteristic makes to the price of a product that offers it.
The challenge with matching is that otherwise identical product pairs are rare. Manufacturers do not release multiple products with every combination of features – as much as analysts might appreciate it if they did. They group updates, so that each new model offers several enhanced features at a time. There are then several improvements at once, and one cannot use product matching to disentangle the impact that each enhancement has on the price of the product. Hedonic regression overcomes this problem. By comparing how different combinations of features affect prices, it is possible to determine what proportion of the product’s price is attributable to each feature. That can allow one to identify a representative price premium even when there are no otherwise identical product pairs.
The price premium is useful because, in certain conditions, it allows one to compare the potential cost of a licence for an implementer to the beneficial impact the licensed technology has on the price of its products, controlling for the impact that other product features have.
To illustrate, consider the evidence on price premia for cellular technology presented in InterDigital v Lenovo. These assumptions are necessarily simplistic, as they use only data available in the decision, and so the figures are not precise. However, they illustrate the principles.
- Firstly, we can consider the benefit that Lenovo gains from implementing InterDigital’s licensed technology. The price premia for 3G, 4G, and 5G were observed to be 26%, 21%, and 21% respectively. Of that benefit, we can attribute to InterDigital’s licensed technology a proportion of each price premium, based on the share of 3G, 4G, and 5G patents that the court decision attributes to it.[14]
- Secondly, we can then consider how the price InterDigital received for enabling that benefit compares. The judgment awarded InterDigital $0.175 per phone.[15] That is less than 5% of the beneficial impact on price that depended on InterDigital’s patented technologies.
Before we consider whether that split between licensors and licensees (if it were accurate) is reasonable, we need to note three issues that limit the extent to which a price premium provides an informative benchmark for the benefits licensed technology creates.
- Price premia ignore incremental costs of production and changes in sales. Ideally, if we want to compare royalties with the benefit the licensed technology provides to implementers, then that is given by their incremental profit, not incremental prices. In practice, implementers may have incremental production costs that partially offset the price premium. For example, a multimode 5G chip might be more expensive than the multimode 4G chip it replaces. Accounting for changes in sales can be more challenging. A technology might not increase prices by much, but nonetheless increase the quantity of products sold. A price premium does not capture the benefit that impact has on implementers’ profits.
- Price premia may ignore implementers’ ability to pass on FRAND royalties. A price premium calculated from unlicensed products does not necessarily impose an upper limit on the maximum royalty that licensed producers could bear once the royalty level has been agreed; licensed producers may be able to adjust their prices, passing a proportion of the FRAND royalty on to their customers. This can be true even if the FRAND royalty exceeds the price premium observed on unlicensed products. For instance, if competition between implementers is very intense (as we should want it to be to increase welfare), it pushes prices down closer to producers’ marginal cost of production – which, before a licence is agreed, may not reflect the FRAND royalties they must eventually pay. However, once FRAND royalties are reflected in producers’ marginal costs, their prices will adjust to reflect that. When competition between implementers is not intense, then pass-through will be weaker because implementers’ prices are already higher due to their market power. Alternatively, if implementers agree lump-sum payments or have already priced in the royalties that they will eventually need to pay, then potential pass-through of FRAND royalties should not be a problem for an analysis based on price premia, as consumer prices would remain the same. The royalty will simply transfer profit from implementers to patent owners.
- Price premia ignore the benefits that licensed technology generates for consumers. Analysing price premia can capture the benefit that patented technology provides to implementers, but not to consumers. When considering whether royalties fairly and reasonably reward innovation, the benefits that licensed technology generates for consumers also matter. If competition between implementers is fierce, for example because entry to the market is made easy by standardisation, the gross margins that implementers can achieve would be low. In such situations, price premia would also be low. This only means that consumers enjoy more of the benefits that standardised technology create, and that implementers were less able to capture a high proportion of those benefits for themselves. Ultimately, the goal of the policy is to incentivise innovation where it creates most value for all, not where one stakeholder group can best appropriate a high proportion of those benefits due to lack of competition.
That does not mean that a price premium is an unhelpful benchmark for the benefits that licensed technology enables. But it is a restricted one. Once incremental costs are accounted for, all the issues above mean that it understates the benefits: licensees may benefit from incremental sales, not just incremental prices; licensees may pass on a proportion of FRAND royalties, protecting a proportion of their incremental unlicensed profit levels; and price premia ignore the benefits of implementing licensed technology for consumers entirely, which we should still seek to incentivise and reward IP holders for enabling. As such, a price premium is useful, but it provides a limited picture, understating the full benefit of implementing the licensed technology.
Benchmark 3: why the value-added for all parties is the most informative benchmark
The final potential benchmark answers the question we want to ask, but cannot answer if we only look at product prices or price premia: how does a royalty reward patent holders compared with the benefits their licensed technology enables for all parties, including consumers?
We can estimate this benchmark using the PVA approach, which determines:
- the impact that patented technology has on the economic value of a product market; and
- how that additional value is shared between patent holders, implementers, and consumers.
To illustrate how it works, consider a simplified example.
First, we can calibrate an economic model with market data to understand how consumer demand, production costs and competition between implementers interact to create value, and how that value is split between producers and consumers.
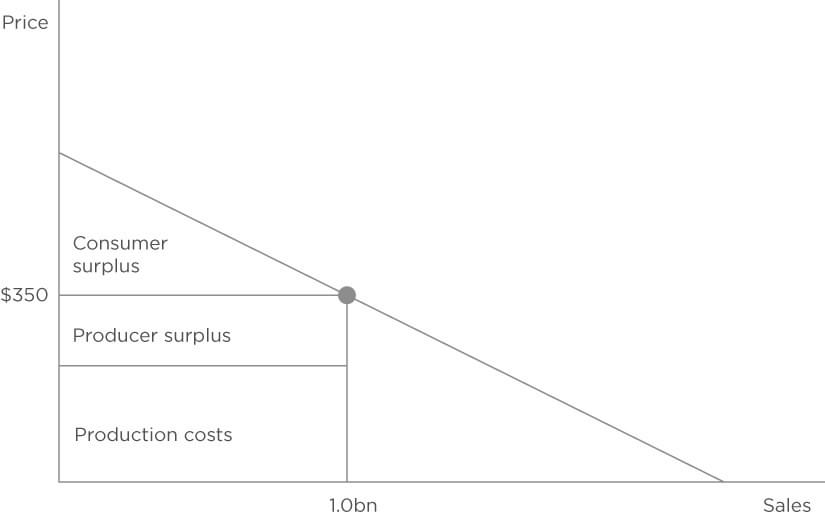
For instance, Figure 1 shows (using hypothetical and illustrative figures) that, in a smartphone market where consumers buy 1.0 billion phones a year, at an average price of $350, and producers make 20% gross profit on average, which means producer surplus is $70bn. In this market 30% of the phones have 5G. As we know from standard economic principles, total surplus is split between consumers and producers, but their shares differ, depending on the intensity of competition between producers – this determines how much surplus they can capture for themselves as a profit. For the purpose of this illustration, the intensity of competition is such that producers capture half of the total surplus, and consumers get the other half.[16]
Figure 1: A simple model of the smartphone market for producers and consumers
Second, we can calculate the extent to which 5G adds value to that market by comparing the value of two otherwise identical counterfactual smartphone markets: one in which every phone offers 5G, and one in which no phone does. The difference between these two markets reveals the extent to which implementing 5G technology enables benefits that increase consumer demand for phones, and for a given royalty, the extent to which patent holders, implementers, and consumers share in the additional value that increase in demand generates.
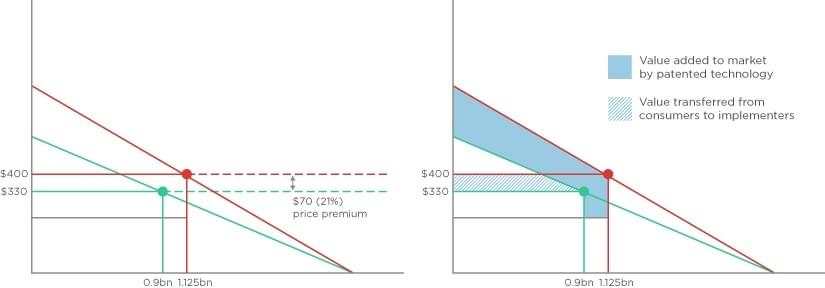
For instance, Figure 2 illustrates the difference in value between those two counterfactual markets.
- Demand increases. As consumers are willing to pay more for phones that provide the benefits that 5G enables, consumers’ demand is higher in the market where every phone offers 5G (in red) than it is in the market where no phone has 5G (in green).
- The increase in demand means that producers can set higher prices and sell more products. In the market without 5G, sales fall to 0.9 billion and the average phone price drops to $330. In the otherwise identical market where all phones have 5G, prices increase to $400 – this implies a 21%, or $70, premium above the prices in the market without 5G. Sales increase to 1.125 billion – 25% more than in the market without the standardised technology.
- The increase in demand adds value to the market. In the market where every phone offers 5G, total surplus has increased to $270bn, which is split evenly between producers (as gross profit) and consumers: $135bn each. In the market where no phone offers 5G, total surplus falls to $90bn. The $180bn difference between the two is the value added by 5G to that market. Of that added value, consumers enjoy half ($90bn) and producers capture the other half in gross profits ($90bn).
Importantly, this analysis isolates the proportion of value created in the market that depends on the licensed technology. It does not attempt to allocate to SEP holders a proportion of the total economic value or surplus of the 5G market. In this example, $90 bn (33%) of the total surplus generated by the 5G smartphone market has nothing to do with the licensed 5G technology (although the other features that value depends on may include older generations of cellular technology).
Figure 2: Comparing the value of the smartphone market with and without 5G technology
Armed with this insight, we can now consider the extent to which a royalty rewards patent holders, not in abstract, but as a proportion of the value that their technology enables for others: implementers and consumers.
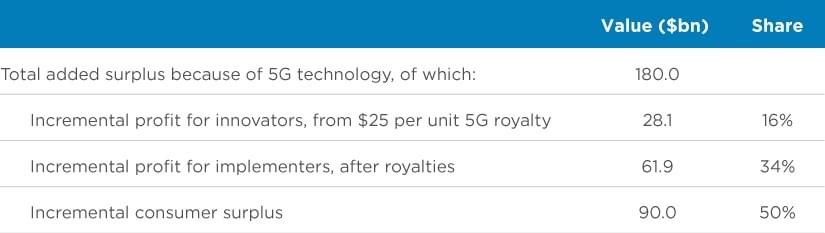
To illustrate, assume an aggregate 5G royalty rate of $25 is proposed, not including earlier generations of cellular technology. That would:
- award SEP holders $28 bn, which is 16% of the total surplus their licensed technology contributes to the smartphone market, and 31% of the incremental profits that depend on it; and
- award implementers and consumers 34% and 50% of the value added to the 5G market by cellular technology respectively (Table 2).
Table 2: Illustration of the present value added approach (hypothetical example)
Assessing whether a proposed royalty provides compatible incentives for licensors and implementers
The benefits that licensed technology enable depends on the contribution of both its innovators and implementers. The price for licensing that technology determines each parties’ reward for that contribution, and their incentive to contribute in the future: the royalty itself is an SEP holder’s slice of the pie; the implementer’s incremental profit, after paying the royalty, is its slice; and the more competitive markets are, the greater consumers’ slice will be.
A useful benchmark reveals how a proposed agreement would share that value between the disputing parties and consumers. That transparency helps a court discriminate between rival proposals for the FRAND rate, by allowing it to choose the one that would lead to fairer and more reasonable outcomes.
To illustrate, consider a hypothetical FRAND determination where a judge must choose between three proposed royalties that would award to SEP holders an effective aggregate royalty of $3.50, $25.00, or $40.00 respectively.
Table 3 shows how each proposal – stated both as an effective unit rate and an implied lump sum payment – compares with that technology’s price premium ($70) and the surplus value it adds to the implementer’s product market ($180bn, representing the combined effect of the price premium, increase in sales, and increase in the consumers’ willingness to pay, as shown in Figure 2).
Table 3: Illustration of benchmarks for three potential aggregate royalties paid in lump sums
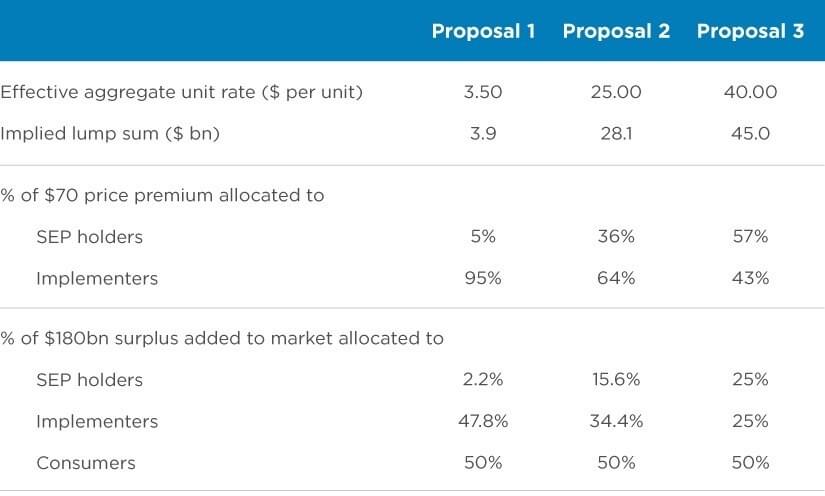
How do we now determine which of the three proposals is more likely to be FRAND? From that consideration, the following points emerge.
First, both sides must be able to participate. For a successful standard, this is likely straightforward. To achieve this condition, both sides of the negotiation must be net beneficiaries after accounting for incurred costs. For innovators, even Proposal 1 in Table 3 may be sufficient to fund minimal R&D – although we might want evidence that it does. For implementers, they can participate whenever their share of the net benefits would cover their incremental production costs and any additional fixed costs they must incur to implement standardised technology. Straightforwardly (but assuming fixed costs are not too high), each of the proposals above would allow an implementer to benefit from implementing standards in its products.
Second, equally valuable contributions warrant equal reward. Each side of an SEP negotiation incurs some risk to contribute to the value their actions create. In economic terms, this cooperative effort creates a “double-sided moral hazard” problem, which leads to the following dilemma: the greater one side’s own share of the reward, the more likely that side is to take the risk to compete, contribute, and benefit; but the smaller the other side’s share, the less likely that side is to compete and contribute, which then constrains the size of the pie that the side with the lion’s share enjoys. In these circumstances, when the contribution made and risk incurred on each side is equal, both sides will benefit most when they agree to an equal split of the value their cooperation generates.[17]
Third, we should not necessarily expect that balanced incentives require equal reward in this case, but we should expect the party claiming a larger share of the created value to justify the deviation from that reference point with evidence. Deviation from an equal split between innovators and implementers should be expected, as the two sides are unlikely to have faced equal risks and made equal contributions. However, as the split between implementers and innovators becomes increasingly skewed, the burden should be higher on the favoured side to justify how that skewed reward is necessary to:
- Balance each side’s incentive to contribute and take on the risk it faces. Balanced incentives would require uneven reward if, for example, contributions on one side are relatively cheaper than on the other, with many firms offering competitive solutions, and/or one side’s contributions are less valuable than the other side’s contributions. If the inclusion of new technologies in the standard brings only marginal improvements, but new ways of implementing these technologies – for instance, by creating entirely new types of products – creates more value, then the value the two sides create should be split in favour of implementers.
- Incentivise implementing complementary technologies in products. The value attributable to implementing a standardised technology may overlap with the value attributable to implementing other complementary technologies. In these cases, implementers need some incentive to combine technologies where that benefits consumers. In that case, the compensation to one innovator whose licensed technology contributes to that complementary value should ensure that an implementer can still compensate and incentivise the other innovators of licensed technology who contributed to that complementary value. This is the same principle recognised when rewarding the licensors of complementary technologies within a standard.
The considerations above help a court interpret the analysis of comparable contracts. The FRAND commitment is not an abstract concept, it has a clear policy objective that some proposed royalties promote better than others. By comparing the prices proposed for a licence with the benefits that licensed technologies create, it becomes clear which proposal will better support that objective. An added benefit is that such an analysis should have a rationalising effect on the rates parties infer from comparable contract – once parties know it will be transparent how they each propose to split the pie their agreement creates, they have less incentive, or ability, to argue for extreme and unsupported outcomes.
Finally, it is worth noting that the outcome of a single FRAND determination in isolation is not the only issue that should concern us (even if that is what should concern courts); very wide variation between different determinations is bad in itself. In the illustration above in Table 3, one court might award a skewed royalty reflecting Proposal 1 (5% of price premium). In contrast, another decision might award a less skewed royalty, closer to Proposal 2 or 3. Ultimately, all negotiations for SEP licences occur in the shadow of litigation. Disputes emerge when the parties have irreconcilable expectations about the rates they might gain in court, as an alternative to the rates they could otherwise agree between themselves. The wider and less predictable courts’ FRAND determinations are, the more disputes we should expect.
To reduce the number and length of disputes, it is necessary to narrow the range of prices that FRAND determinations based on comparable contracts might impose, and to improve the predictability of those determinations. That requires a clear methodology for assessing comparable contracts, and a clear understanding of how the price of a licence compares with the benefits that licensed technology enables, as well as what impact the price would have on each side’s incentives to compete and contribute. Those benefits are the value that the licensed technology adds to society.
View the PDF version of this article.
Read all articles from this edition of the Analysis.
References
-
Pekka Sääskilahti is a Senior Vice President at Compass Lexecon. Andrew Tuffin is a Senior Policy Advisor at Compass Lexecon. The views expressed in this article are the views of the authors only and do not necessarily represent the views of Compass Lexecon, its management, its subsidiaries, its affiliates, its employees or its clients.
-
That preference has been stated in recent cases in the UK, and US cases at the start for the Smartphone Patent Wars. Interdigital v Lenovo FRAND (2023) EWHC, 539 (pat). Judiciary.uk [online]. Available at: https://www.judiciary.uk/judgm.... Microsoft Corp. v. Motorola, Inc., Case No. C10-1823JLR (W.D. Wash. Apr. 25, 2013); Innovatio IP Ventures, LLC Patent Litig., No. 11 C 9308, 2013 WL 5593609, at *37-29, *43 (N.D. Ill. Oct. 3, 2013).
-
Having criticised both sides’ evidence, Justice Smith commits to use “broad brush or broad axe as necessary” given that he must make a determination regardless. Optis v Apple (2023) EWHC, 1095 (ch), [455].
-
For example, in Innovatio IP ventures.
-
For example, in Optis v Apple (2023) EWHC, 1095 (ch) [318].
-
Optis v Apple (2023) EWHC, 1095 (ch), [301-307].
-
Interdigital v Lenovo FRAND (2023) EWHC, 539 (pat). Judiciary.uk [online]. Available at: https://www.judiciary.uk/judgments/interdigital-v-lenovo/
-
For example, in Optis v Apple (2023) EWHC, 1095 (ch) [319].
-
ETSI (2023), ETSI Directives, Version 48, ANNEX 6: ETSI Intellectual Property Rights Policy, para 3.1
-
Re Optis v Apple (2023) EWHC, 1095 (ch), [222c].
-
Re Optis v Apple (2023) EWHC, 1095 (ch), [212-223]; Robert O’Donoghue KC, and Jorge Padilla. Law and economics of Article 102 TFEU, Third Edition. Bloomsbury Publishing, 2020. Chapter 13.
-
The seminal paper is Rosen S. (1974) Hedonic Prices and Implicit Markets: Product Differentiation in Pure Competition, JPE 82, 1, 34-55.
-
The price premia are presented in paragraph 844; the average price for 3G, 4G, and 5G phones are presented in paragraphs 850, 847ii, and 851 respectively; the sales mix for the period 2019 to 2023 is presented in paragraph 808i; and the InterDigital’s share of patents for each standard is presented in paragraph 846. Combining these, we estimate the price premium attributable to 3G, 4G, and 5G technologies in the weighted average phone was $48.92, of which $4.37 is attributable to Interdigital – assuming for illustrative purposes that all SEPs are equally important, which they are not in reality. Interdigital v Lenovo FRAND (2023) EWHC, 539 (pat). Judiciary.uk [online]. Available at: https://www.judiciary.uk/judgments/interdigital-v-lenovo/
-
InterDigital v Lenovo FRAND (2023) EWHC, 539 (pat), [814] Judiciary.uk [online]. Available at: https://www.judiciary.uk/judgments/interdigital-v-lenovo/
-
This simplified case, provided for illustrative purposes, is a market with homogenous products, capacity constraints, symmetric firms, and linear consumer demand. In the illustration: producer surplus is $70bn ($350 x 20% c 1.0bn); consumer surplus is $70bn (due to the intensity of competition between producers mean that total producer surplus and consumers surplus are equal). The ratio of consumer surplus and producer surplus depends on the intensity of competition. In this type of market, a monopolist phone producer would capture two thirds of the total surplus (producer surplus and consumer surplus) and the deadweight loss would be equal to the consumer surplus. As competition between rival producers intensifies, the deadweight loss reduces, and total surplus increases with consumers gaining a greater share of it.
-
Sugato Bhattacharyya, Francine Lafontaine, “Double-Sided Moral Hazard and the Nature of Share Contracts”, RAND Journal of Economics, Vol. 26, No. 4, 1995. The “Shapley value” would also lead to a 50/50 split for perfect complements, which the jointly created value of innovators and implementers would be. See Anne Layne-Farrar, A. Jorge Padilla, and Richard Schmalensee, “Pricing Patents for Licensing in Standard-Setting Organizations: Making Sense of FRAND Commitments”, 74 Antitrust L.J. 671 (2007).
Related insights
-

The Analysis • 28 Feb 2024
The return of long-term contracts for electricity: Implications for competition policy
-
The Analysis • 28 Feb 2024
The not so-simple interaction between labour and product markets: Applications to competition policy
-
The Analysis • 22 Feb 2023
What the ex-ante benchmark reveals about the reasonable price for SEP licences