Harvesting Insights: Patent Networks in Agrochemical Mergers

Share
Introduction
In this article, Angelos Stenimachitis, Tristan Salmon, Laura Ashirepbay, Federico Bindi, Arpita Pattanaik and Anqi Shan discuss how patent data can help analyse the impact of mergers on innovation output.
Innovation, competition and patents
The relationship between competition and innovation has been studied by economists at least since Schumpeter (1942) argued that firms with market power can promote innovation more than those operating in a fully competitive market.
An extension to this debate is whether mergers between competitors are likely to promote or hurt innovation.[1] Despite many authors discussing this, both on a theoretical (Federico et al., 2017) and empirical level (Schmutzler, 2013, Hauscap et al, 2016), it remains an open question. Mergers can have an ambiguous effect on innovation (Aghion et al., 2005) which likely depends on the specifics of the merger and the industry (Hashmi, 2013).[2]
Shapiro (2012) notes that, in a merger, firms would try to balance a reduced incentive to innovate with a higher ability to do so.[3] There are thus, two opposing effects of mergers between competitors on innovation.
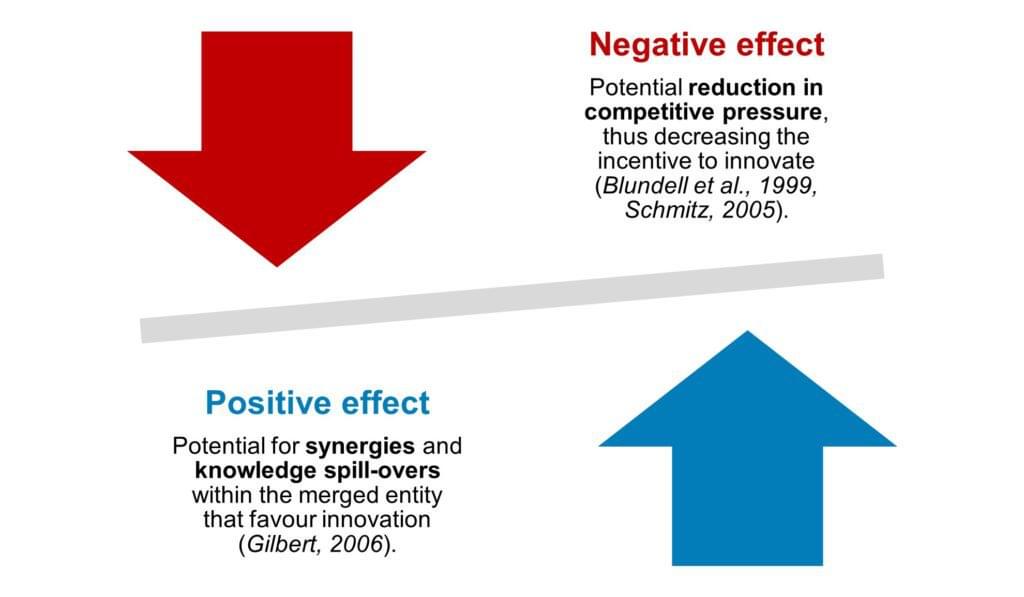
Assessing which effect is likely to dominate in a particular setting can be difficult for practitioners and authorities alike. An important element in any assessment of the impact of a merger on innovation is understanding how closely linked firms’ innovation activity is.[4]
One way to approximate innovation activity is using patent data (Hashmi and Van Biesebroeck, 2016, Kang, 2021), especially for R&D-intensive industries.[5] This allows us to assess how close firms are in the type of patents they file, as well as the degree of interconnection between them and to other close competitors.
In its assessment of the Dow/DuPont proposed merger in 2017, the European Commission (‘EC’) calculated shares of patents based on their relevance to product markets, considered the overlap and relative strength of the notifying parties for “high quality” patents in these markets, as well as that of other major competitors.[6]
In assessing the impact of a merger on innovation in practice, some of the specific questions that practitioners may want to answer are:
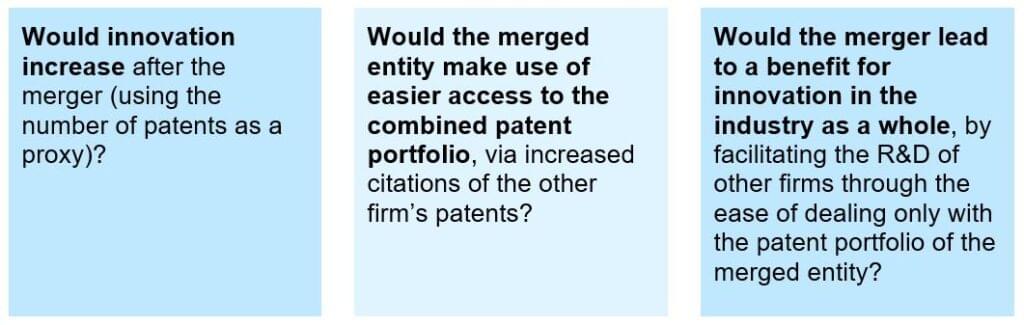
In this article, we illustrate an approach to assess the overlap and interconnection of firms, as well as to look into the likely impact of mergers on innovation activity, focusing on the Seeds and Agricultural Chemicals industry (hereafter ‘Agrochem’).[7]
The Agrochem industry characteristics lend themselves to such an analysis as:
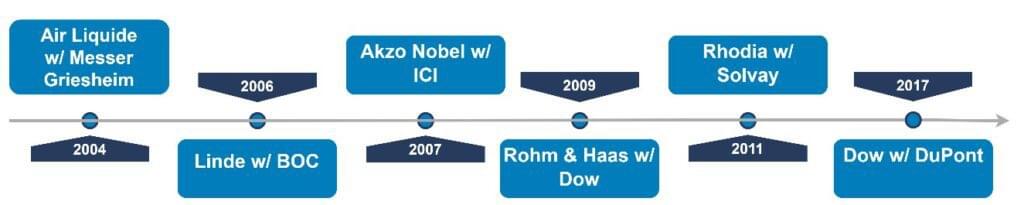
“[i]nnovation in the crop protection industry largely takes place through product innovation that is protected by effective IPRs [intellectual property rights] and other defence strategies to sustain high profit margins, even post patent expiry […]” [8] It is considered a “discrete” industry, with a strong link between single patents (or patent families) and commercialised products. A wave of over 33 mergers took place in this industry over the last 30 years, involving over 56 different firms (hereafter ‘merger wave’), with some prominent examples shown in Figure 1 below.Figure 1: Prominent Agrochem mergers
We demonstrate the use of novel tools to inform this debate with network analysis.[9] We assess how networks of patents change, and how and to what extent innovating firms rely on other firms’ patents, changes and potentially benefits from the merger. The network analysis is largely descriptive and cannot necessarily identify causal effects.
Before looking into specific merger case studies, we discuss the patent data we use and the concepts of network analysis.
Network analysis with patent data
How can we approximate a measure of innovation?
Firms tend to protect their innovation activity through Intellectual Property Rights, most often with patents for new products and/or technology.
For data on patent activity, we use PATSTAT (provided by the European Patent Office).[10] PATSTAT is a comprehensive database of patents, including details about the patent itself, its citations and a classification of the subject the patent relates to with the International Patent Classification (‘IPC’).[11]
For the purposes of this article, we only consider citing patents filed in the period of 1989 to 2019, and the corresponding cited patents, both belonging only to IPCs related to agrochemical components.[12]
How can we observe firm links?
Patents are owned by individuals or firms to protect novel products, processes or, in this case, materials and chemical ingredients. When relying on other patented output, patents must cite the relevant patents and their owner.
In this way, citations between firms allow us to observe the links between firms’ innovation output, as firms typically rely on patents owned by other firms.
In the PATSTAT data, we thus have a citing patent and firm and a cited patent and firm:
A citing patent is the patent filed by the citing firm; while A cited patent and cited firm are those referenced by the citing patent.Network analysis concepts
To examine how firms relate to each other, we need to look in more detail at the networks formed between them, using basic concepts of network analysis.
A network is a structure representing a group of objects (called centres or nodes) and relationships/connections between them (called connections or edges).
An example is Facebook: each user profile is a centre, and all the friends of that user are also centres, linked to one another by connections. In Figure 2 below, every picture is a profile, and every line is a connection. Disconnected centres would mean the users are not Facebook friends.Figure 2: An example network of individuals

As networks can include a very large number of centres and complex connections start forming between them, network metrics can help us to summarise them. These include measures of how many potential connections between centres are realised or whether we observe firms serving as important intermediaries.
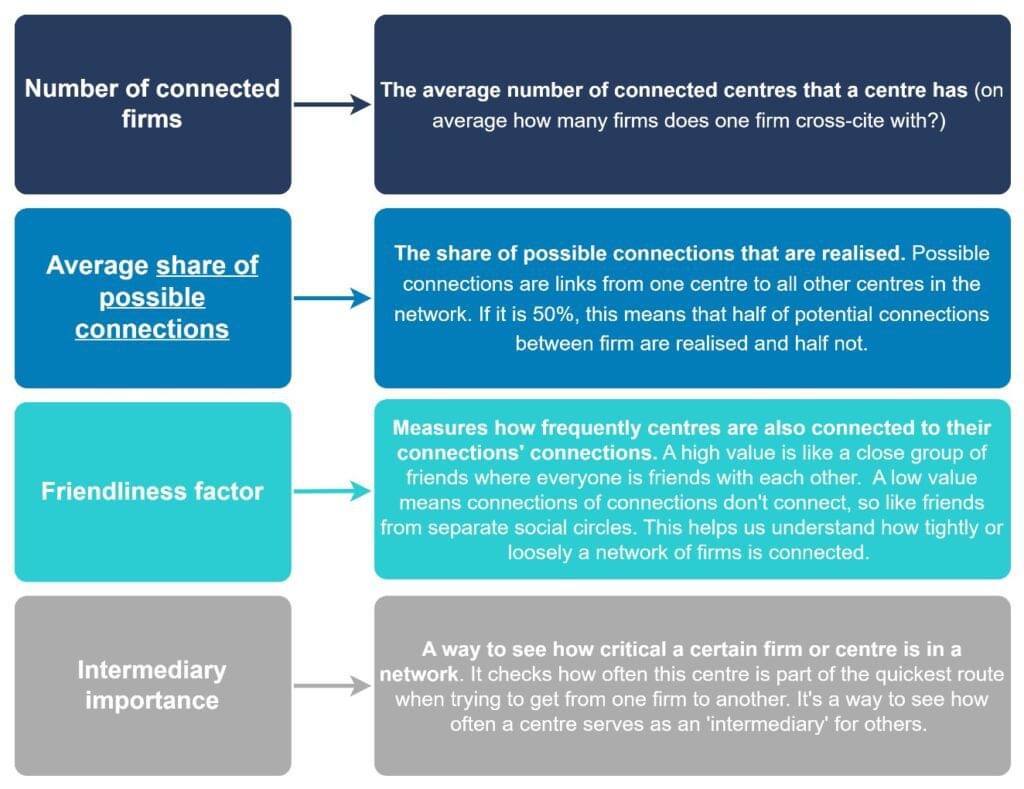
Using such measures allows us to examine the state of networks and thus how these change in response to a merger. The metrics we have used for our illustrative analysis in this article are summarised in Figure 3 below.
Figure 3: Explanation of the network metrics applied
Firm level patent networks in the Agrochem industry
We investigate the networks formed in the Agrochem industry between firms identified as part of the merger wave. Here a centre is a firm, and the connections are cross citations between firms.
Before examining the network metrics, we look at some simple descriptive statistics to help understand the industry.
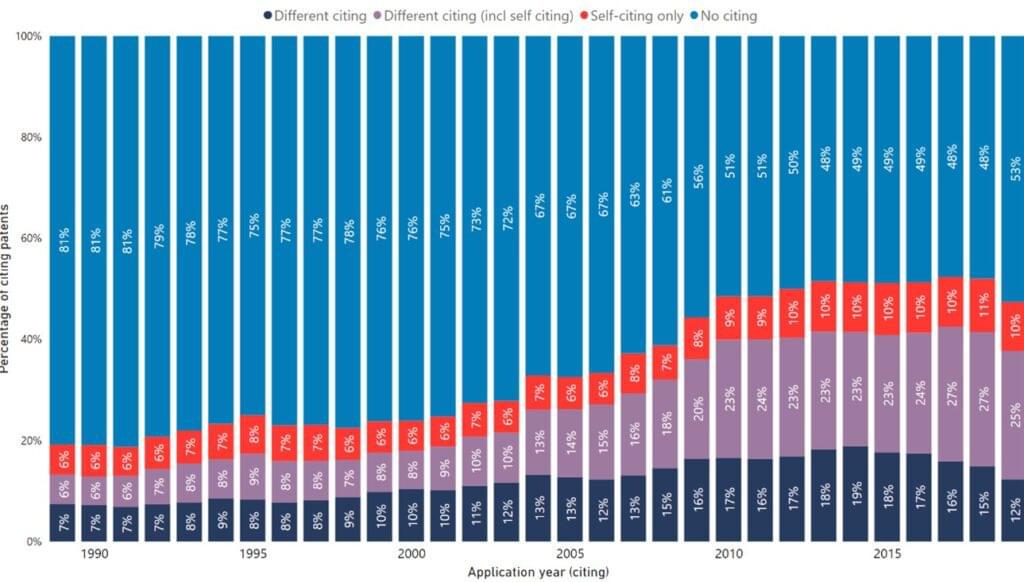
The share of patents that cite no other patents decreases over time, suggesting more interconnectedness overall in the industry or more complex discoveries that, inadvertently, rely on other patents.Figure 4: Do firms cite other firms?
In Figure 5, we visualise this network (each dot is a firm and each line is a connection or citation). We observe that the network has a small number of firms at its centre with a large number of connections to other firms. This suggests that some firms play an outsized role in the innovation activity of the industry and their patent portfolio is frequently cited by their competitors.
It also implies that firms with a large number of connections to each other may benefit from R&D synergies. However, the extent of such benefits is likely to depend on factors such as the terms of access of each firm to the proprietary knowledge of other firms.
Figure 5: Firm level network
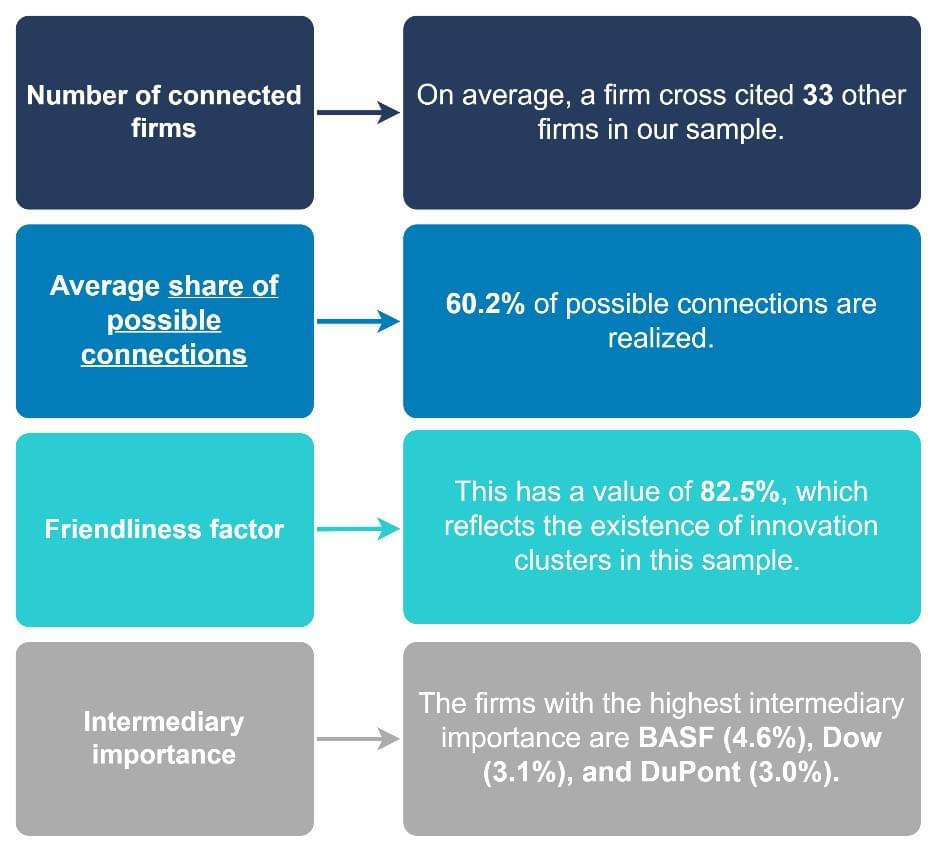
We observe that, on average, each firm has connections with 33 other firms. This suggests a large degree of interconnection of knowledge in the industry. This is also highlighted by the share of possible connections, as 60.2% of all possible connections between firms are realised. Given that a score near 100% would mean that, on average, each firm’s patent portfolio cites that of all other firms in the sample, this score implies the relevant knowledge in the industry is very dispersed.
The network also has a very high friendliness factor, at 82.5%. This suggests that firms are usually also connected to the connections of their connections (again, this can be thought of as a relatively tightknit group of friends where a person’s friends are friends with each other). This further implies a network where firms’ R&D is very interconnected and commonly reliant on the broad body of the industry firms’ research.
Lastly, assessing how critical particular firms are to the industry’s body of knowledge, by looking at how often they act as the intermediary for others, we see that BASF (the largest patent holder of the network) has the highest intermediary importance at 4.6%. Dow (the third largest patent holder) and DuPont (the fifth) at 3.1% and 3.0% respectively follow.
Figure 6: Network metrics applied at firm level
Patent level case studies, before and after mergers
We now zoom in on two mergers and look at interconnections at the patent level. Here, firms’ patents are the centres and the citations between patents are the connections.
We consider the networks before and after the merger.
The inclusion of the patents cited by those filed intends to represent the network as all patents relevant for the innovation output of the period. To facilitate comparability and to take into account the firms’ internalisation of the merger (to the extent possible) we consider the network metrics for the period of 5 years before and after the merger.The cases we examine for indicative purposes in this article are (i) Air Liquide and Messer Griesheim in 2004 and (ii) Solvay and Rhodia in 2011.
Out of the total of 33 mergers, we chose these in particular because:
the number of patents filed is fairly balanced between the two firms, so that it is possible to study the integration between the two firms. The analysis would still be valid otherwise, however if one of the merging parties has filed significantly more patents than the others any integration effects might be diluted.Case study: Air Liquide - Messer Griesheim (2004)
In 2004, Air Liquide, a French industrial gas company, acquired Messer Griesheim, a German industrial gas company, for €2.9 billion ($3.6 billion). The acquisition made Air Liquide the largest industrial gas company in Europe and one of the largest in the world.[13]
In Figure 7 below we illustrate the firms’ patent-level networks, looking at the average network of patents filed within 5 years before and 5 years after their merger. Each dot (centre) represents an Agrochem patent, belonging to either of the two firms, that has been filed or cited in that period and connections represent the cross-citations.[14]
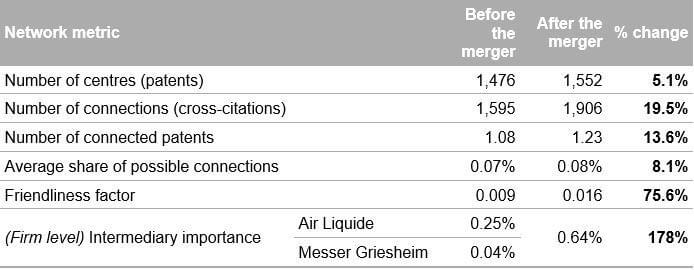
Figure 7: Air Liquide and Messer Griesheim patent networks before and after the merger
The relevant patents in the period after the merger took place increased by 5.1%. The number of connections, meaning the number of times the patents of each firm cited those of the other, increased by almost 20%.
In addition, the number of connected patents, meaning the number of citations a patent in the network receives on average, has also increased by 13.6%. Taken together, these increases suggest the R&D process of the merged entity became more interconnected, and that innovation output increased. However, this analysis does not correct for any general trends in patent activity over time, so serves primarily as suggestive of the routes for further analysis.
We also observe a small (8.1%) increase in the average share of possible connections, with a higher share of firms’ patents being connected in the period after the merger.
The highest increase seen is of the friendliness factor, meaning that the patents in the combined portfolio tend to cite a greater number of other patents referenced post-merger. This result also points to a greater interdependency between the patents, and thus produced innovation, of the previously distinct patent portfolios.
Considering the possible effect for the broader industry, from the firm-level network analysis we see that the intermediary importance of the combined entity after the merger increased considerably compared to that before the merger. The magnitude of the increase, even considering the increase in patents after the merger, suggests that the combination of the portfolios created a more important centre in the network, one that facilitated other firms’ patenting activity.
Table 1: Network metrics for the Air Liquide-Messer Griesheim merger
Further analysis is needed to identify any causal links between these changes and the merger, but they may indicate a positive effect for innovation from the merger. The combined entity had a higher innovation output in the period after the merger, its patents relied more on one another and likely became more interdependent. The merging entity’s combined portfolio also became considerably more important as an intermediary centre in the industry network, suggesting it facilitated other firms’ citations more after the merger.
Case study: Solvay - Rhodia (2011)
Solvay, a Belgian chemical company, active primarily as a soda ash maker, acquired the French company Rhodia for €3.4 billion ($4.8 billion).[15] Solvay suggested the acquisition allowed it to broaden its activities beyond chemical and pharmaceutical manufacturing to supply of speciality chemicals of a broad variety.[16]
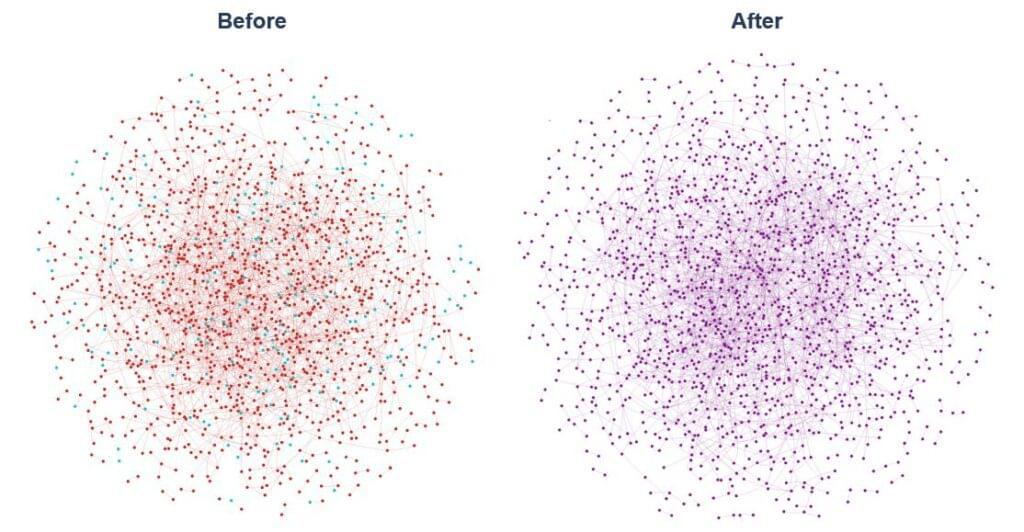
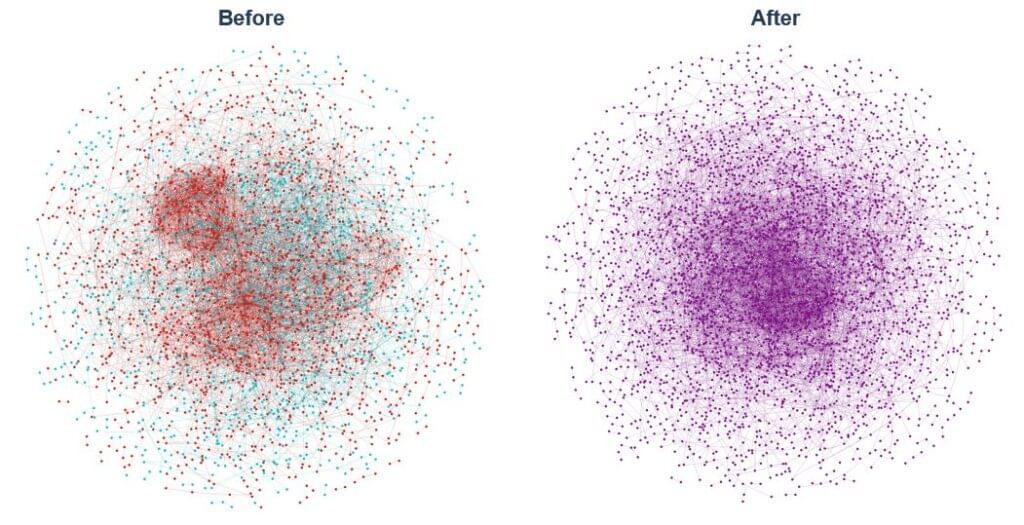
Figure 8 illustrates the firms’ pre- and post-merger patent networks. From a visual assessment of the network, we see that Solvay had a small number of clusters, seen in the very “lumpy” concentrations of patents, which suggest a number of very closely related patents. After the merger, we see only one such large concentration, indicating that the merged entity has had a different focus in its innovation output.
Figure 8: Solvay and Rhodia patent networks before and after the merger
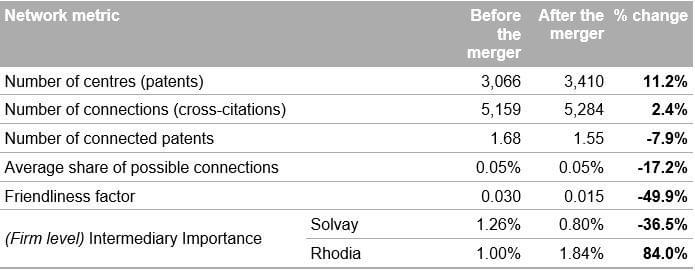
We find the relevant patents in the period after this merger took place increased more markedly, by 11.2%. This increase however is not accompanied by an increase in the number of connections, which increased by only 2.4%.
Therefore, the number of citations a patent in the network receives on average goes down in the post-merger period by almost 8%. Taken together, these results suggest the higher output is not linked to higher interconnection of the R&D process of the merged entity.
This is further emphasised by the decrease in the average share of possible connections by 17.2%, meaning that a smaller share of the patents is connected in the period after the merger. Such a result points to the innovation of the post-merger entity focusing more on the non-overlapping areas of the pre-merger entities’ portfolio.
The large decrease of the friendliness factor, by nearly 50%, points in the same direction. A more modular network has limited collaboration between more distinct sub-networks and suggests that the firms may have focused less interrelated research that does less to exploit the unified patent portfolio. This interpretation is also in line with the stated aim of the merger, to broaden the types of products and diversify the combined entity to broader chemical applications.
Lastly, considering possible effects on the industry as a whole, from the firm-level network analysis we see that the intermediary importance of Rhodia, which carried the portfolio of the combined entity’s declared research and product focus, increased materially by 84%. At the same time, the research of Solvay, which based on the transaction rationale is likely to have moved away from the Agrochem specialisation, decreased in importance.
Table 2: Network metrics for the Solvay - Rhodia merger
The combined entity had, consistently to the previous case study, a higher innovation output in the period after the merger. At the same time, its patents become less relevant to one another and appear to make less use the pooled knowledge of the combined entity. As noted, this outcome seems to align with the declared intention of the merger.
What is made patently clear?
We explored how innovation is affected by mergers through the lens of network analysis. Compared to a simple count of patents, network analysis allows for a more detailed assessment of changes in the interconnectedness of innovation between merging firms.
As shown in Figure 5, patenting and innovation in the Agrochem industry relies considerably on knowledge sharing, with copious citations among patents filed by different firms.
In the case studies examined we found that:
the mergers in the case studies examined may have led to a benefit for innovation in the industry as a whole. Depending also on the rationale for the examined merger and the patenting strategy the merged entity followed, the importance of the merged entities within the patent networks increased, thereby facilitating the R&D of other firms through as their combined patent portfolios appears to be more important for the industry patent network than the combination of the individual ones.Each merger is a distinct case and unobservable factors can affect network metrics in various directions, the interpretation of the analysis has to be considered within the particular context. The mergers examined provide indicative evidence of a positive impact on innovation activity. Standard economic analyses can also be used to the same effect. However, the use of network analysis allows us to investigate the nature of the likely changes of firms’ innovation efforts, such as the direction and types of innovation and their extent. For example, we saw that a decrease in the average share of possible connections and friendliness factor may result from the merged entity strategically diversifying their intellectual property portfolio to different industrial applications (as classified by the IPC codes) to allow for a broader scope of products.
Network analysis of patent data can help provide valuable insight on innovation effects not found in simple descriptive metrics and demonstrate the likely effects for future innovation activity. For relevant cases, it can help generate, inform and present compelling arguments on such effects. The findings of network analysis can also suggest directions that a more extensive analysis with econometric techniques can look into to help identify the drivers of the effects. Even with further insight through network analysis, the effect of mergers on innovation is likely to remain the subject of lively debate and requires a case-by-case analysis.
About the Data Science Team
The Compass Lexecon Data Science team was created to bring the latest developments in programming, machine learning and data analysis to economic consulting.
Sometimes this involves applying novel techniques to assess specific questions in an innovative and compelling way. For instance, running a sentiment analysis on social media content related to merging firms can be informative on their closeness of competition, and can supplement the results of a survey.
Other times it is about making work faster, more accurate, and more efficient, especially on cases which involve large datasets.
This short article is part of a series of articles showcasing how data science can lead to more streamlined and robust economic analysis and ultimately to better decisions in competition cases. If you would like to find out more, please do not hesitate to contact us at datascience@compasslexecon.com.
[1] The related debate on how merger control affects firms’ incentives for innovation (e.g., kill zones against start-up incentives) is not considered in this article.
[2] Regibeau and Rockett note that “The relevant question is not, “What are the effects of a merger on innovation?” but, rather, “What are the effects of a merger on innovation given that the static effects of the mergers are appropriately handled by the Competition Authority?””, see Mergers and Innovation, Pierre Regibeau and Katharine E. Rockett, The Antitrust Bulletin, 2019, Vol. 64(1) 31-53.
[3] See Carl Shapiro, Competition and Innovation: Did Arrow Hit the Bull’s Eye? The rate and direction of inventive activity revisited, 361 (J. Lerner & S. Stern eds., 2012).
[4] See, for example the discussion in: Justus Haucap, Alexander Rasch, Joel Stiebale, How mergers affect innovation: Theory and evidence, International Journal of Industrial Organization, Volume 63, 2019, Pages 283-325, ISSN 0167-7187, https://doi.org/10.1016/j.ijindorg.2018.10.003
[5] See also: https://www.oecd.org/en/publications/oecd-patent-statistics-manual_9789264056442-en.html
[6] See M.7932 Dow / DuPont | Competition Merger Brief No 2/2017, in https://ec.europa.eu/competition/publications/cmb/2017/kdal17002enn.pdf
[7] See the EC’s decision for M.7932, Dow/DuPont, found in http://ec.europa.eu/competition/mergers/cases/decisions/m7932_13668_3.pd
[8] Note this includes crop protection products such as pesticides and seed treatments. [1] See M.7932 Dow / DuPont | Competition Merger Brief No 2/2017, in https://ec.europa.eu/competition/publications/cmb/2017/kdal17002enn.pdf
[9] Network analysis has been used to some extent to study patent activity previously. For instance, Acemoglu et al. (2016) use a network of US patent citations across sectors to study how innovation in one sector spreads to adjacent sectors.
[10] See here: https://www.epo.org/searching-for-patents/business/patstat.html .
[11] For more information, see https://www.wipo.int/classifications/ipc/en/
[12] These are: A01H, A01N, A01P, A23G, A61L, B01D, B01F, B01J, B05B, B05C, B05D, B29B, B29D, B32B, B65D, C01B, C01G, C02F, C03C, C07B, C07C, C07D, C07F, C07H, C07K, C08B, C08F, C08G, C08J, C08K, C08L, C09B, C09C, C09D, C09J, C09K, C10G. For further detail on IPC codes, see here: https://www.wipo.int/classifications/ipc/en/.
[13] See https://www.bloomberg.com/pres... (last accessed at 15/08/23)
[14] Note that, for the sake of visual clarity, in the patent-level networks we only picture the centres that are connected to at least one other centre.
[15] See https://economictimes.indiatimes.com/news/international/solvay-acquires-rhodia-in-specialty-chemicals-move/articleshow/7871083.cms?utm_source=contentofinterest&utm_medium=text&utm_campaign=cppst (last accessed 16/08/23)
[16] For further context, see the EC decision M.6230, Solvay/Rhodia in https://ec.europa.eu/competition/mergers/cases/decisions/m6230_20110805_20310_1985609_EN.pdf
[17] See Koenig, M., Mezick, E., Impact of mergers & acquisitions on research productivity within the pharmaceutical industry. Scientometrics 59, 157–169 (2004).
[18] See Llobet, Gerard and Padilla, Jorge, A Theory of Socially-Inefficient Patent Holdout (2021).
Related insights
-

Article • 17 Jul 2023
Shift Happens: Navigating the Big Data Paradigm
-
Article • 22 Feb 2023
A taste of geospatial analysis for competition economics
-
Article • 07 Dec 2022
Decision Search Tool: Behind the Scenes