Evidencing market definition in TV and digital advertising: the TF1/M6 case

Share
Defining relevant markets remains an important part of many competition cases. However, constraints often prevent rigorous empirical analysis, which can leave parties trading plausible intuitions that point in opposite directions.
In this article, David Sevy, Antoine Victoria, Marion Chabrost and Wiktor Owczarz [1] describe how they cut through those constraints using data science in the proposed merger between TF1 and M6, bringing a level of rigour and evidence to the market definition exercise that would have been otherwise impossible or impractical to achieve.
View the PDF version of this article.
The views expressed in this article are the views of the authors only and do not necessarily represent the views of Compass Lexecon, its management, its subsidiaries, its affiliates, its employees or its clients.
Introduction
It is not always clear whether two products belong to the same market. Technically, it depends on whether customers consider them as substitutes for one another, which can be challenging to determine.[2] Substitutability is often a matter of degree: so, any particular line drawn between products that are “in” the relevant market and those that are “out” may be arbitrary (this is the “binary fallacy”). In challenging cases, this can provide conflicting intuitions. It will be clear that we should consider the products as substitutes to some extent, but not whether they are substitutes to a sufficient extent for the purpose of market definition.
This difficulty was evident in the proposed merger of TF1 and M6 – the two largest private TV broadcasters in France (hereafter, “the Parties”) – which was recently assessed by the French Autorité de la concurrence (hereafter, the “FCA”) and subsequently abandoned. [3] A crucial question for the FCA’s review was whether the Parties’ TV advertising activities were in the same market as other forms of advertising, including as digital advertising, or their own separate market.[4] Ultimately, answering that question depends on whether advertisers consider TV and digital advertising as substitutes, competing to serve the same needs, or as different services, fulfilling different – and possibly complementary – objectives.
Rigorous empirical analysis can guide market definition, but various constraints – including time, costs, and paucity of data – mean that it is rarely applied in practice.[5] Instead, markets are often defined based on “some guidance from theory and some qualitative knowledge".[6] That might be adequate in some cases, but in others, it risks arbitrary and potentially misleading reasoning.
In the proposed merger between TF1 and M6, [7] data science techniques provided useful evidence on market definition. A key question in the case was the extent to which advertising on two distinct channels – TV and online – was substitutable. Data science techniques allowed us to collect and analyse data on whether advertisers used these channels for different and complementary needs, or for similar purposes. Although the analysis did not reveal demand substitution patterns directly, it provided evidence on the parameters affecting customers’ choices with a degree of rigour that was previously unattainable. Similar techniques can – depending on the case – either cut through the barriers that typically impede empirical approaches, or they can indicate that a more detailed assessment of substitution patterns (for instance, through surveys) is required and help target such analysis.
In this article, we first outline the core issue we addressed – substitutability of the TV and online channels for advertisers. We then describe the data science techniques we used to analyse advertising campaigns, present our main results, and derive lessons for future cases.
Assessing the substitutability of advertising on TV and online
In principle, there are rigorous ways to test whether digital advertising is a sufficient substitute for TV advertising. The framework for market definition is the “hypothetical monopolist test” (“HMT”): a relevant market is one worth monopolizing – that is, a market where a hypothetical monopolist could profitably sustain increased prices by 5-10% over time (a “small but significant and non-transitory increase in price”, or “SSNIP”) while prices outside that market remain the same. If a high enough proportion of customers for a given set of products will switch to alternatives following a SSNIP – that is, if a high enough proportion of customers are “marginal"[8] – the boundaries of the proposed market should be larger. One way to apply the HMT is “critical loss analysis”, which measures the amount of sales that would have to be lost before a hypothetical SSNIP becomes unprofitable. We can also use surveys to establish customers’ propensity to switch to alternatives following a SSNIP.
Other analyses can provide useful insights, using descriptive and qualitative evidence on products’ characteristics, their intended use, and other parameters that affect customers’ choices. [9] These analyses are not substitutes for a full analysis under the HMT framework, as they do not go to the core of whether customers would substitute one product for another following a SSNIP. However, they are often necessary to set the stage for analysis, helping to understand why customers choose one product over another.
In practice, using empirical analysis to define markets is rare. This is particularly the case for rigorous analysis of substitution patterns, but also for analysis of the characteristics that motivate the choices of customers.[10] Frequently, constraints on data or time make such analyses difficult or unfeasible. But without the support of concrete evidence, there may only be intuition to fall back on. Not only can intuition be arbitrary and potentially misleading, often – as in the case of TV and digital advertising – it can point to plausible but conflicting directions. A robust analysis can inform the assessment by unpicking these intuitions, and where needed it can guide more targeted analysis by shedding light on avenues for future inquiry.
Defining the market “narrowly” or “broadly” can have a substantial impact on a competition authority’s deliberations. In this case, the impact that alternative market definitions had on the Parties’ combined market share was substantial. The Parties accounted for around 70% of the revenue from TV advertising in France in 2021. That share reduced to around 55% if the market also included video social and display adverts, and to approximately 40% if it also included non-video adverts. So, it was important that the rationale for any particular definition was rooted in evidence.
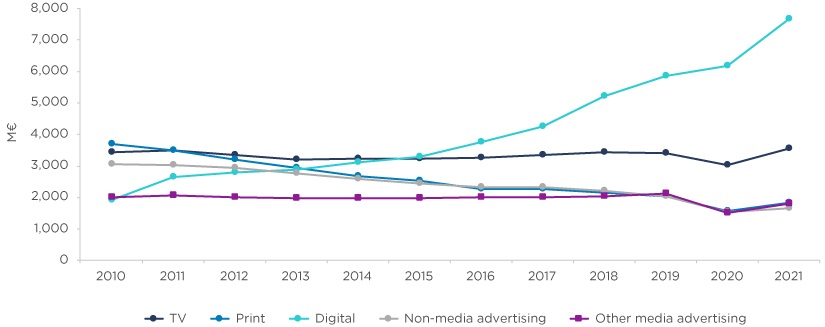
The FCA’s practice had been to define TV advertising “narrowly” in its own market, excluding digital advertising. In contrast, the Parties proposed that a “broader” market definition was more appropriate, citing the rise of digital advertising as a competitor that now constrained their revenues.[11] Figure 1 shows that the rise of digital advertising has been dramatic. Its revenues in France quadrupled between 2010 and 2021 to 7.7 billion euros, close to half of total advertising revenue. The main digital advertising channels are search advertising (hereafter “search”), adverts on social media (hereafter “social”), and adverts on other websites and applications (hereafter “display”). Search accounted for 19% of total advertising revenues in France, social constituted 12%, and display constituted 9%.[12] Video advertising on social and display advertising channels accounted for 8% of all advertising revenue. On the other hand, revenues from TV advertising have remained stable over the last decade in absolute terms, with only a slight increase. In 2021, TV accounted for 21% of total advertising revenues; a substantial share.
Figure 1: Evolution of advertising revenue by form of advertising in France (2010-2021)

Source: Compass Lexecon analysis based on data from BUMP.
Notes: 1: The category “Non media advertising” includes advertising mail (paper format), unaddressed admail, and phone books. 2: The category “Other media advertising” includes cinema, radio and out of home advertising channels. “Out of home” advertising is visual advertising located outside consumers’ homes, and includes roadside formats (such as billboards), as well as adverts on transit.
The trends in advertising revenue do not have, in themselves, clear implications for market definition. Digital advertising certainly appears to have replaced traditional forms of advertising to some extent. For instance, revenues for print advertising, the top form of advertising in 2010, had more than halved by 2021, becoming the third most valuable form overall – far below digital and TV. But even then, the fact that advertisers continued to spend across a range of distribution channels neither conclusively demonstrates that they used them for different purposes, nor that they viewed them as substitutes in the same broad product market for advertising.
Providing new and original evidence on substitutability: the role of data science
Whether advertisers substitute between different forms of advertising, such as TV and digital, in part depends on what they use them for. Do they view the different forms of advertising as close enough substitutes fulfilling the same purpose? Or, instead, do they view them as fulfilling different – possibly complementary – objectives? This was the question our team – drawing on their expertise in both economics and data science – devised an original analysis to answer, avoiding the barriers that typically constrain empirical evidence when defining markets.
We built a unique dataset, which contained the advertising campaigns of 30 major advertisers active both on TV and on Meta’s social and display advertising platform in France.[13] Then, we analysed the purpose of each ad to assess the extent to which companies used ads across different advertising channels for different purposes. We built the dataset using Optical Character Recognition (OCR) techniques to process the information from hundreds of images and videos. Without these techniques, it would have been impossible to collect the data affordably, or in a reasonable timeframe. With the techniques, it was quick – a matter of days.
Collecting data on display and social advertising (Meta): web scraping and digitization
We sourced data on display and social advertising from the Meta AD library.[14] Through web scraping and digitization of text from images and videos, our data scientists created a database of 1,400 unique display and social advertisements.
Step one: Building the advertising database, using web scraping
Web scraping is an automated process to collect data from websites. Collecting advertising data from the Meta AD library required identifying where the website recorded the advertisements published by the 30 major advertisers.
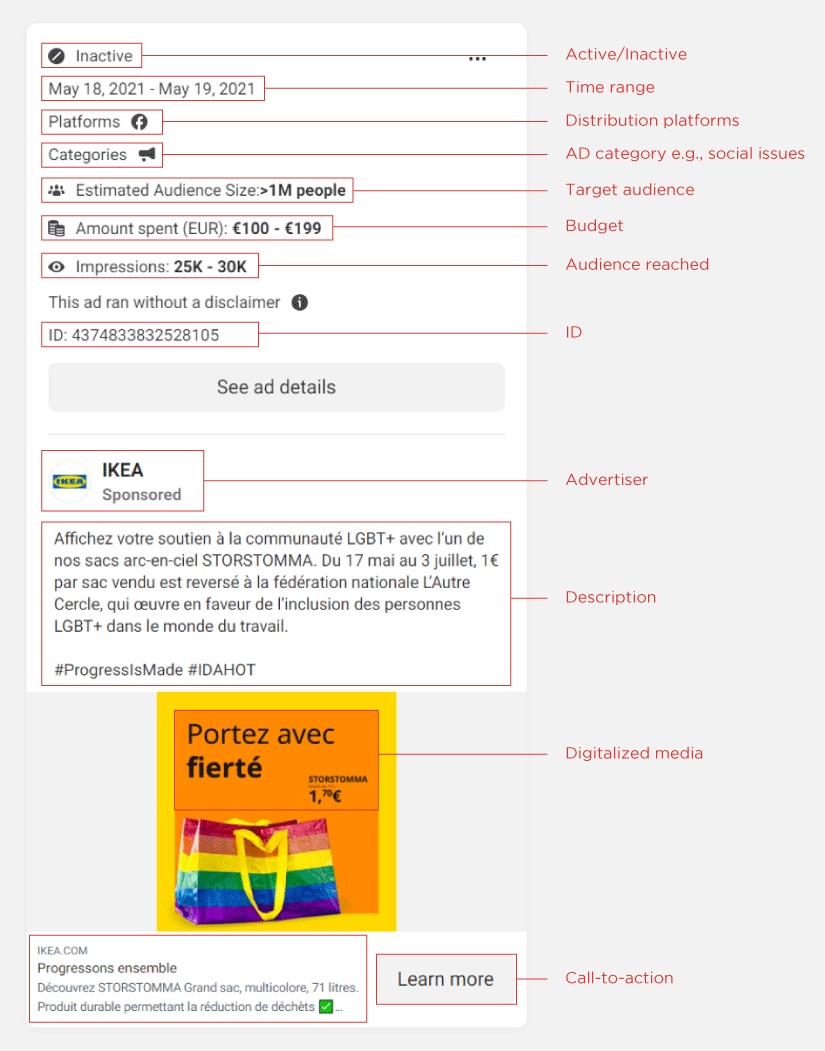
Figure 2: Information structure for Meta advertisements

Source: Compass Lexecon based on Meta AD library.
Each Meta advertisement followed a typical structure – as shown in Figure 2 – which our tool relied on to collect all the necessary data: images, videos, and metadata which included, among other things, the identity of the advertiser, a description for the ad, and the target audience.
Step two: Extracting the content of image and video ads, using digitization of text
We relied on OCR techniques to identify and extract the text accompanying image and video ads. The technique we opted for used neural networks trained on scene text images to identify “natural scene text” with greater accuracy than other methods. It also supported multiple languages, including French (as required for our analysis), a clear advantage over other tools.
Figure 3: The text extraction process

Compared to the extraction of standard text (which is usually black print on a white background and follows a line-by-line format), extracting text from advertisements poses additional challenges. Advertisements generally have colourful and unstructured text against a non-uniform background. In addition, many advertisements are dynamic videos, which increases the difficulty of text identification. Videos need to be split into brief frames, to which OCR techniques are applied. A last step removes text duplicated across multiple frames.
With all analysis, validation is crucial. To verify the accuracy of the automated techniques used for digitalization, a sample of the advertisements was audited. This auditing process involved a manual review of the digitalized data against the original images and videos to ensure that the automated techniques were accurately extracting the necessary information. By performing an audit, we found high levels of accuracy for key information later used to discriminate between ads in analysis, such as prices.[15]
Data on TV advertising
Iliad, a French telecommunications company (active, inter alia, as an advertiser and as a distributor of TV channels), provided us with Kantar data for each TV ad broadcasted by our sample of advertisers over the period 2019-2022. The data included the ad’s script, its visuals, its duration, the period over which it was broadcast, and on which TV channels, among other things. We focussed the analysis on advertising broadcasted on TF1 and M6, which led to a set of 800 TV ads over the period of analysis.
Assessing whether digital ads and TV ads had complementary, rather than competing, objectives
A formal SSNIP test analyses an effect: whether customers decide to substitute one product for another. It doesn’t need to analyse customers’ reasons for switching between two products. However, we can use data science to better understand the factors that motivate customers’ decisions. In this case: what the products do (their characteristics), and what customers want each of them for (their objectives). Although that doesn’t replace a full-fledged analysis of substitution patterns, it can – in circumstances where a full-fledged analysis is rarely conducted – allow us to better understand whether customers are likely to see two products as substitutes, complements, or unrelated. It can also help frame the parameters of further analysis and identify which customers are more likely to be “marginal”, that is, more likely to switch to alternatives.
Assessing how the characteristics of TV and digital ads differ
The characteristics of adverts shown on TV and on digital media differ in various ways.
First, the reach of TV advertising is unmatched in scale and speed by digital advertising. TV advertising can have massive reach (in the millions, for some sports matches and popular TV shows). Even programmes broadcast late in the evening on smaller TF1 and M6 channels attracted more viewers than the median number of impressions that ads on social and display channels achieved.[16] In addition, TV has instant reach: it takes only one TV ad to engage with hundreds of thousands if not millions of viewers. In contrast, Meta ads must be shown for several days to reach their target number of impressions, but can be targeted based on characteristics such as interests, gender, age, and location. [17]
Second, TV advertising has more narrative power than digital ads because ads on TV last longer than digital ads. In the data, TV ads lasted 30 seconds on average, which is twice the average length of a Meta ad.
Third, TV advertising is known to be “safer” reputationally for brands than digital channels.[18] This is because, for instance, advertisers know exactly around which TV content their ads will be displayed, which is not the case for digital ads.
On their own, differences in characteristics don’t determine whether two products are in the same market. However, the nature of the differences is informative. The different characteristics of the advertising channels affect the way that business customers engage with each channel. Data on those differences helps us assess whether two products are likely to provide the same functionality to customers in a different way or, rather, serve different needs on the basis of their differing characteristics.
Assessing how the objectives of ads on TV and digital differ
The marketing funnel: awareness, consideration, conversion
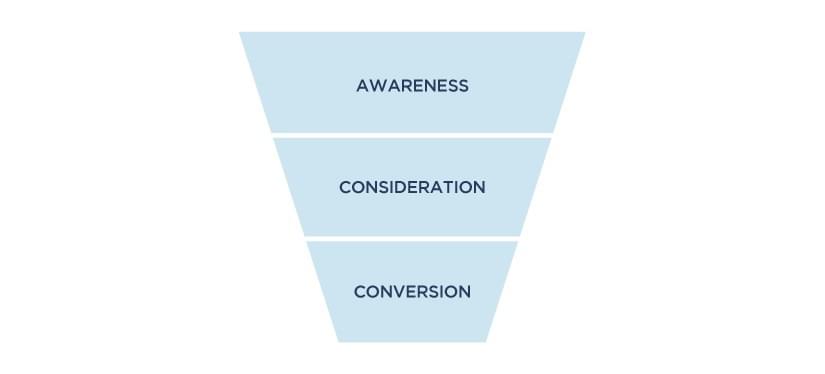
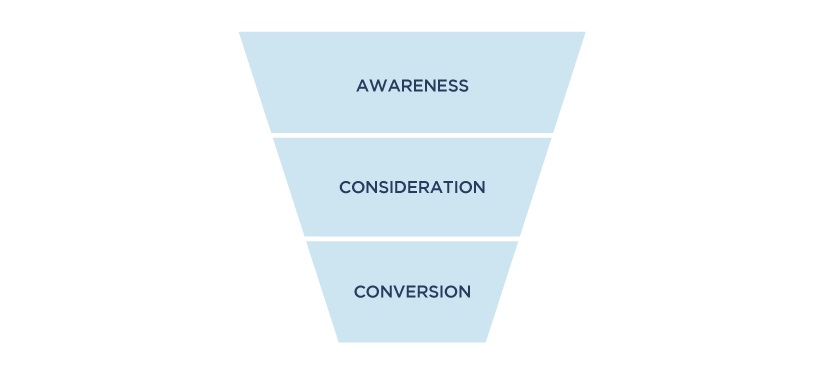
We can also analyse customers’ motivations for buying each product to better assess whether they are substitutes for one another or not. A common framework for understanding the different marketing objectives is the “marketing funnel” (see Figure 4). The marketing funnel describes a customer’s journey through three stages: from learning about a product or brand (“awareness”); to active interest and information collection (“consideration”); to purchasing the relevant product or services (“conversion”). Brands plan various marketing “actions”, including advertising, to address customers’ needs at each stage of the marketing funnel, from awareness, to consideration, to conversion into a purchase – with the aim to shift the customers to a later stage of the funnel.
Figure 4: The marketing funnel
Source: Microsoft Advertising Blog (2022), “Leverage brand awareness to drive growth for your brand”.
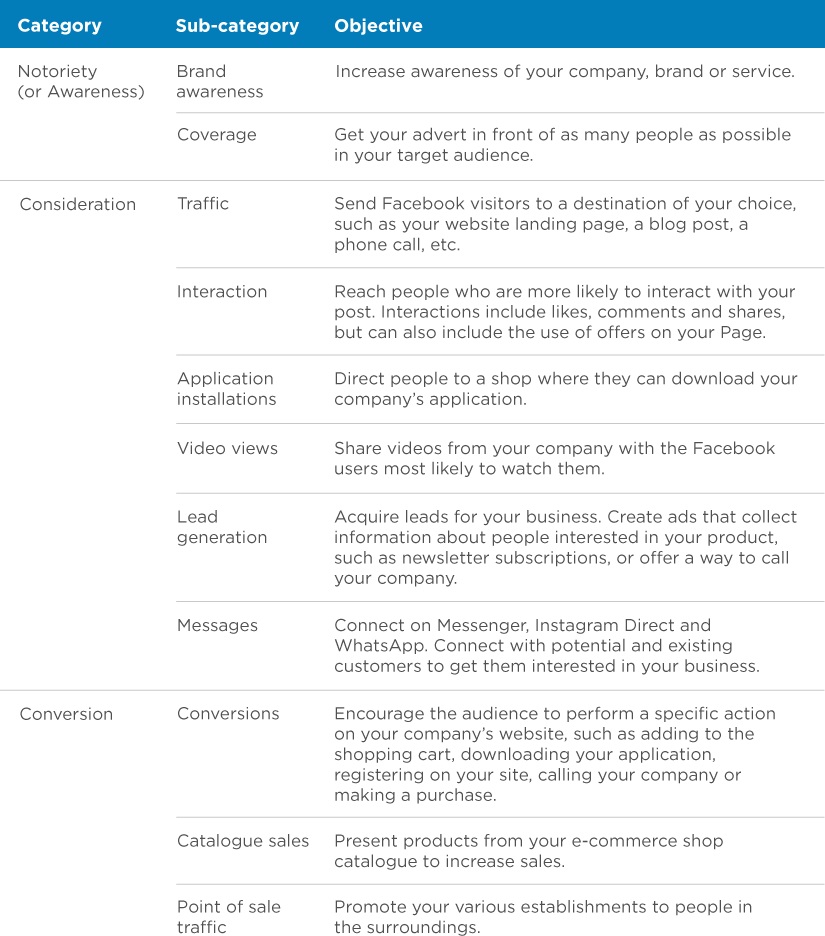
To understand how different types of advertising met these three needs, we classified all TV and display and social ads in our dataset according to these three objectives based on a combination of automated analysis and manual review and validation. In a first step, ads with a conversion objective have been identified based on an automated identification of prices and keywords such as “special offer” and manually audited thereafter. Then, in a second step, the ads have been manually classified based on Meta’s classification of advertising according to the objective of each stage of the marketing funnel (see Table 1 below).
Table 1: Objective of the campaigns according to Meta
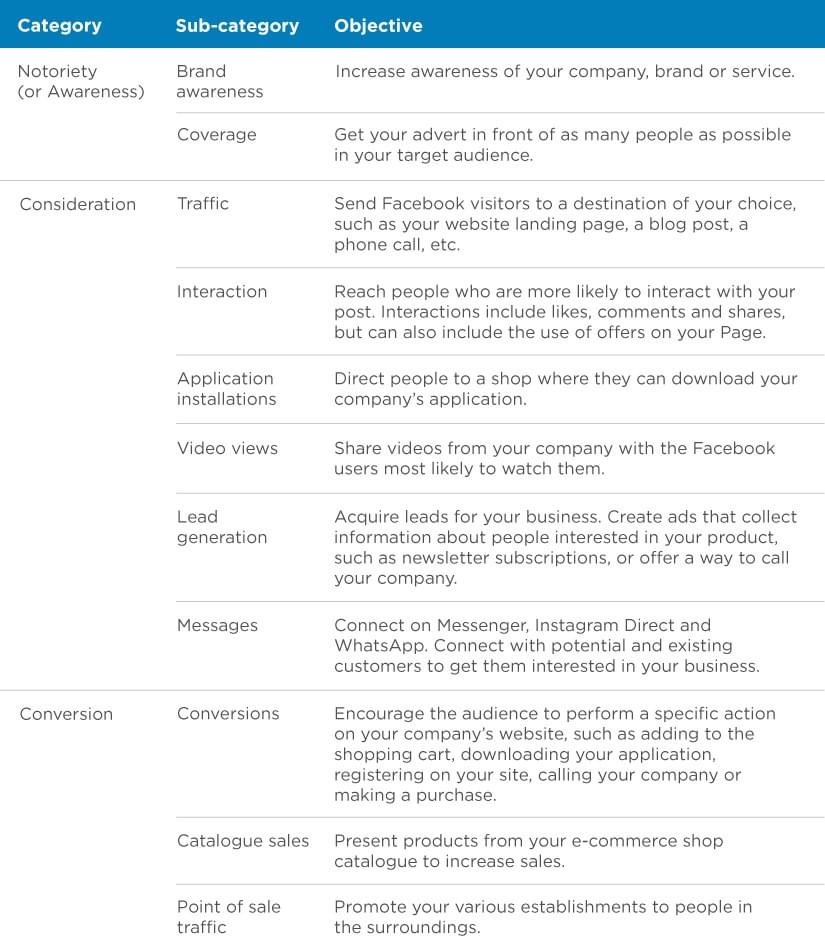
Source: Meta.
Note: Meta’s classification has been recently updated since Compass Lexecon produced its Report. This Table reports Meta’s classification as of May 2022.
Analysing how companies use TV and Meta advertising in practice
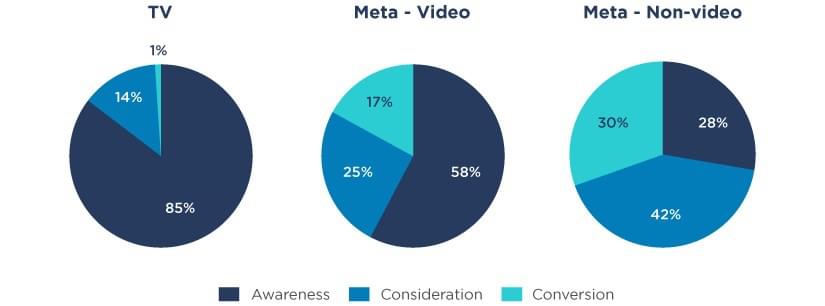
Figure 5 summarises the extent to which companies used TV advertising on TF1 and M6 to achieve each of their three marketing objectives (awareness, consideration or conversion), and how that compares with how those same companies used display and social advertising on Meta (video and non-video).
Figure 5: Distribution of advertising campaigns by objective
Note: “TV" relates only to advertisements broadcast on the TF1 and M6 channels.
Source: Compass Lexecon analysis based on data from Kantar and Meta.
Our analysis shows that:
- TV advertising was primarily used to raise awareness (85% of TV ads), with consideration playing a secondary role (14%), while conversion was virtually absent (1%);
- in contrast, the share of Meta video ads dedicated to consideration and conversion was much higher than on TV (25% and 17% of Meta video ads respectively); and
- this was even more significant for non-video Meta ads, where 42% of ads were aimed at consideration and 30% at conversion, and only 28% of ads aimed to increase awareness.
Such analysis enabled much more informed judgments than would have been possible otherwise about the extent to which the companies viewed TV advertising and digital advertising as substitutes, complements, or unrelated. For instance, where companies have used different types of advertising to achieve objectives in different parts of the marketing funnel, it is likely they used them as complements for one another, not as substitutes. The analysis also identifies the limited extent to which the different forms of advertising appeared to serve the same objective, suggesting they could be substitutes. That would not have been possible in this case without the novel data collection and classification techniques devised by the Compass Lexecon team. In general, this type of analysis can help unpick the initial conflicting qualitative intuitions and, in cases where further analysis is needed, it can be better targeted having tested the initial intuitions.
Ultimately, the view that the FCA adopted in the case was that TV advertising and alternative channels (digital social and display advertising) were not seen as sufficiently substitutable from the point of view of advertisers to be considered part of the same market, which is consistent with the FCA’s previous practice. [19]
Lessons for future cases
The lessons from this exercise are twofold. First, assumptions on demand substitutability and market definition should be tested and supported by evidence, not just intuition. Second, data-driven approaches and data science can make it possible to quickly quantify and test the intuitions that often take the place of rigorous analysis. They can either directly test the initial intuitions, or help guide further analysis where required – bringing a level of rigour that otherwise would not have been possible.
Read all articles from this edition of the Analysis
View the PDF version of this article.
[1] David Sevy is an Executive Vice President at Compass Lexecon. Antoine Victoria is a Vice President at Compass Lexecon. Marion Chabrost is a Senior Economist at Compass Lexecon. Wiktor Owczarz is a Senior Data Scientist at Compass Lexecon. With thanks to Ethan Soo, a Data Scientist at Compass Lexecon, for his contribution to the analysis. The views expressed in this article are the views of the authors only and do not necessarily represent the views of Compass Lexecon, its management, its subsidiaries, its affiliates, its employees or its clients. This article is informed by economic support provided to Iliad in the context of the Autorité de la concurrence’s investigation into the TF1/M6 broadcasting merger. Iliad is a major player in the European telecom sector, active in France both as an advertiser and as a distributor of TV channels through the commercial brand Free. See Compass Lexecon (2022), “Iliad succeeds in opposing French TF1/M6 broadcasting merger”, 27 October.
[2] European Commission (1997), ”Commission Notice on the definition of relevant market for the purpose of Community competition law”, OJ 1997 C372/03, para. 13-19. Supply-side substitutability may also be taken into account when defining markets in those situations in which its effects are equivalent to those of demand substitution in terms of effectiveness and immediacy (ibid., para. 20).
[3] The FCA’s investigation revealed that the merger could have significant anti-competitive effects, mainly in the markets for TV advertising and for TV distribution services. Shortly after a hearing in September 2022, the Parties stated that the set of remedies required to approve the contemplated merger would be too substantial to justify the strategic rationale for the deal – i.e., responding to increased competition from digital platforms – and the Parties abandoned their merger plans.
[4] It was not controversial in the case that the geographic market should be national.
[5] Padilla, J., J. Perkins, and S. Piccolo (2023), ”Market definition in merger control revisited”, in I. Kokkoris and N. Levy (ed) “Research Handbook in Competition Enforcement”, Edward Elgar. See also Perkins, J. (2021) ”Market definition in principle and practice”, The Analysis, Compass Lexecon.
[6] Carlton, D. (2007), “Market Definition: Use and Abuse”, Competition Policy International, Vol. 3, No. 1, p. 27.
[7] Compass Lexecon provided economic support to Iliad. See Compass Lexecon (2022), “Iliad succeeds in opposing French TF1/M6 broadcasting merger”, 27 October.
[8] OFT (2004), “Market definition”, p. 7.
[9] European Commission (2022), Draft “Commission Notice on the definition of the relevant market for the purposes of Union competition law”, para. 51.
[10] Padilla et al. (2023), op. cit. at footnote 5. See also Perkins (2021), op. cit. at footnote 5.
[11] Abboud, L. (2022), ”French television deal at risk after competition regulator report”, FT, 27 July.
[12] Other types of digital advertising include affiliate marketing, emailing and price comparators.
[13] Most of the main advertisers were active across both TV and online channels; only a small proportion relied only on one of the two forms of advertising.
[14] Meta, “Ad library”.
[15] As noted in the next section, it was important to detect whether ads included information on prices, because this was a factor to help discriminate between ads with different purposes.
[16] Audience figures add up single viewers. On the other hand, several impressions can come from the same person (who can view the ad multiple times).
[17] Meta, “Audience ad targeting”.
[18] Brand safety is the practice of protecting a brand’s reputation and keeping it from appearing in unsafe environments. See, for instance, Inspection Générale des Finances (2020), “Publicité en ligne: pour un marché à armes égales”, p. 15: “the path of the advertising, from the advertiser to the space on the website where the campaign is displayed, cannot be reconstructed. Advertisers have therefore most often no guarantee on the visibility of their campaigns and on the quality of the website on which they are displayed in order to preserve their brand safety.” (authors’ translation)
[19] See for instance FCA press release (2022), “TF1/M6: l’Autorité de la concurrence prend acte de la décision de Bouygues de retirer son projet d’acquisition”, 16 September: “the evolution of uses noted following an in-depth examination of this proposed transaction does not allow us to conclude that TV advertising and online advertising are sufficiently substitutable from the point of view of advertisers. Therefore, it does not appear justified to consider them as a single market” (own translation).
Related insights
-

The Analysis • 28 Sept 2023
Chopping off the tail: similar products, different constraints?
-
The Analysis • 28 Sept 2023
Monopsony in labour markets: a new enforcement priority for competition authorities

