Measuring of Competition Using Natural Language Processing

Share
Written by Rashid Muhamedrahimov and Ethan Soo
Summary
As the competition landscape is constantly evolving, the question still remains: Is there a need to revamp the way we measure closeness of competition?
There are many standardised ways to measure how close competitors are. We can supplement these measures with evidence that has traditionally been difficult to quantify, e.g. staff movements between competing firms. In this data science article, we discuss how Natural Language Processing (NLP) can develop novel and impactful measures to allow for more robust analysis of competition.
Following our previous article in The Analysis, Using Natural Language Processing in competition cases, our team present a more technical version of how NLP can solve challenges and automate processes in competition analysis.
Introduction
Closeness of competition is an important consideration in the merger review process. Broadly, it describes the extent to which firms exert a competitive constraint over one another: if customers of Company A are likely to switch to Company B due to a price increase, this suggests that the companies are close competitors.
The concept has historically been very important and, as seen from recent policy shifts – for example in the CMA’s recently updated merger assessment guidelines – will be increasingly important in the future.[1]
Figure 1: Percentage of merger cases mentioning "closeness of competition"
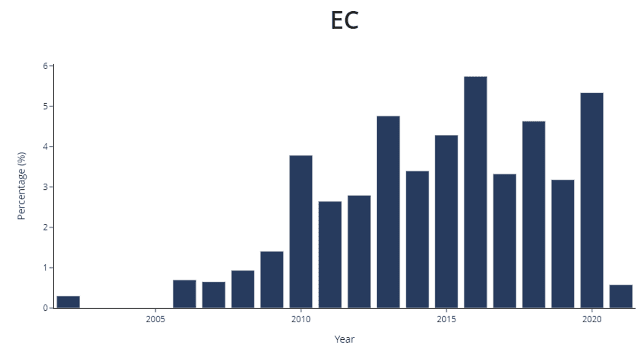
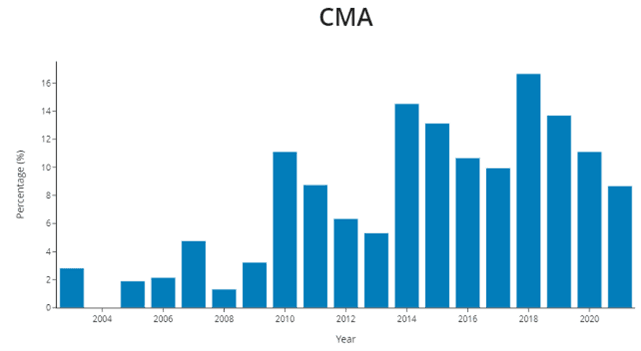
Source: CL Decision Search Tool, for more information see https://www.compasslexecon.com/ecmergerdecisions/
There are several traditional approaches to analysing closeness of competition. Some of these are relatively straightforward. For example, diversion ratios – which measure how consumers switch to alternatives in the face of a price rise – are a well-established metric to assess closeness of competition when considering alternative products purchased by consumers. In some cases, it may also be important to look at other less standard, supplemental measures of closeness of competition. However, these are often more difficult to quantify, due to a lack of easily-available data to test specific hypotheses.[2]
One example of such a supplemental measure is staff movement. In many industries such as technology and professional services, staff are the key determinants of the services offered as well as their quality, and so can affect the competitive position of the firm. In such industries, it is likely that the more that a pair of firms have staff moving between them, the stronger the indication that those firms are close competitors.[3]
However, data on such movements is not easy to observe without obtaining hiring information from the (potentially very large) set of firms involved, matching the datasets and quantifying the movements. This is possible, but challenging.
One option would be to use public domain information. In the public domain, we can often find many sources of information containing information that is valuable for competition analysis – such as news articles covering professional staff movements. The challenge remains that these are often disparate and not in any format that is ready to use for analysis.
We could read every article and extract the data we want by hand; however, this won’t scale very well if there are thousands or tens of thousands of articles. Using Data Science, we can solve these challenges and automate the process using Natural Language Processing (NLP).
Data mining using Natural Language Processing
There are three pieces of information we need to extract from these articles: the person involved, the names of the origin and destination firms, and the direction of the movement.
For this, two classical NLP techniques can be applied: Named Entity Recognition, and Dependency Parsing
Named Entity Recognition: When is an apple not an apple?
For humans, it is easy to tell whether a word refers to a firm or a person (or something else). It is intuitive that Johnson is a surname, but Johnson & Johnson is a company name. Computer programs don’t have such intuition built into them. But we can use a technique from NLP called Named Entity Recognition (NER)[4] which uses algorithms trained using billions of observations and can statistically assess whether a word is a person, firm, country, and so on.
For example, consider the sentence “Apple is looking at buying UK startup for $1 billion”. In such a sentence, “Apple” is clearly referring to the tech firm and not the fruit – and a good NER model is able to establish this, given the context of the sentence.
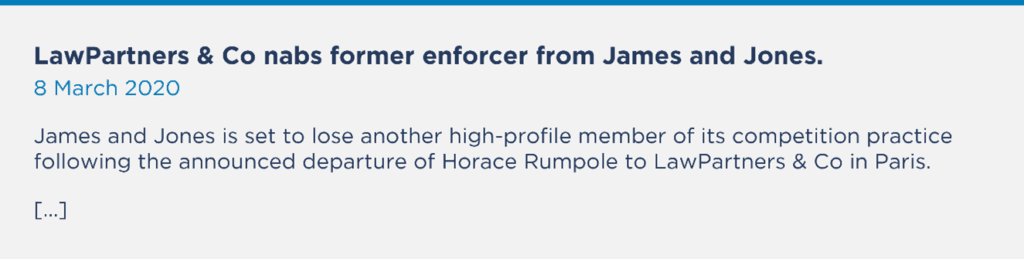
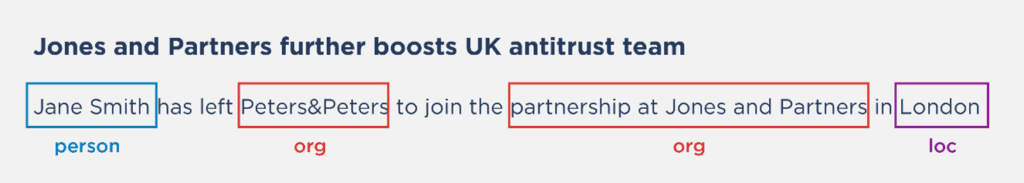
Using NER on the following fictional article gives us the following named entity labels, where:
- person = A human name
- org = an organization
- loc = a physical location such as a city or street
Dependency Parsing: Turns out grammar class was useful
Once we know what the different words refer to and whether they are companies, people, and so on, we can use a technique called dependency parsing to identify the direction of the movement.
This is where we need to open our dusty linguistics textbook. Dependency parsing is the process of analysing the grammatical structure of a sentence.[5] In doing so, it examines the dependencies between the phrases.
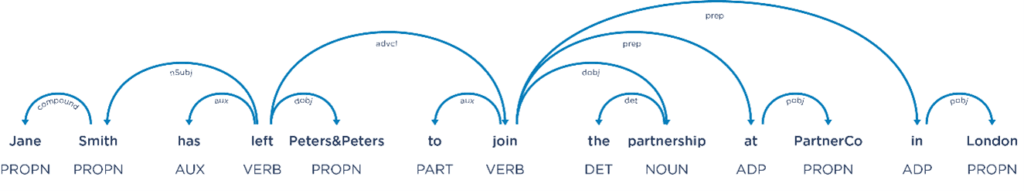
Applying dependency parsing, we can visualise the different parts of the sentence and how they relate to one another. In this example, there are two verbs “left” and “join”. The subject and object of the first verb is “Jane Smith” and “Peters&Peters” respectively, whereas the object of the second verb is “PartnerCo.”
Combining the named entity recognition with the dependency parsing step, we can identify transfers by encoding logical patterns such as:
- a person (has left/departed/has moved) from origin firm (to join) destination firm,
- a destination firm (has hired/has poached) a person from origin firm,
Doing this across a body of texts (for example, those scraped from different web sources), we can create a rich dataset to assess closeness of competition.
Network analysis to understand closeness of competition
Please use the wheel scroll on your mouse to zoom in and out of the interactive network diagram. The network diagram has been truncated for quicker rendering speed.
Visualising the dataset
We applied the NLP techniques above on a series of news articles covering the competition industry (governmental organizations, law firms and economic firms) and found 841 unique moves among 500 separate organizations. This is a lot of information to condense, so a first step is to visualise it in a network diagram. A network diagram is made up of:
- Nodes: in other words, the dots, where each represents a single organization
- Edges: arrows connecting the dots, indicating staff movement between organizations. The arrows can be bidirectional showing movement between two dots have taken place. The thicker the line, the more staff have moved.
The nodes and edges have colours to represent the organization type. Red nodes indicate law firms, green nodes indicate economics firms, blue nodes indicate public bodies (such as competition authorities and courts). Yellow nodes indicate other firms (i.e. firms that do not fall in any category above).
What can we learn from this? The first obvious learning is that closeness of competition in this industry is complex. The set of organizations are highly interconnected, both across and within industries. When looking deeper, a couple of interesting things stand out.
First, we see that there is an obvious clear separation between law firms in red and economics firms in green. This makes sense – we know in our industry that economics firms do not “compete” with law firms, and that we are typically complements to one another.
Second, looking more closely at law firms in red, we see a “core” central group of firms, which are all very closely interconnected. Outside of this core set of firms appears to be a competitive “fringe” of firms that are less connected – these may be firms with smaller competition practices, or boutique firms focusing on specific aspects of competition.
Third, public bodies in blue (such as competition authorities) see transfers across both economics and law firms, with connections both to law firms in the central area of the chart and the more “fringe” area.
Connecting the dots
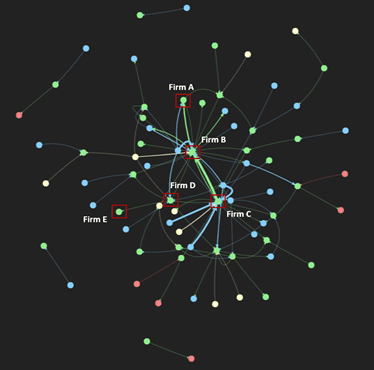
In addition to providing high level insights, this data can also let us test specific hypotheses. For example, we can assess the potential impacts of mergers within the industry. To highlight this, let’s zoom into the economics industry.[6]
Such an analysis can help us test how different mergers might affect competition. For example:
- Firms B and C merging could be problematic. According to this analysis they are the closest competitors (there are 2 edges between the nodes and they have the thickest line, therefore the most transfers between them). Depending on the market power of these firms, this could result in a meaningful lessening of competition.
- Firms A and C merging might be problematic. They do not have any transfers directly between each other, but they do both have transfers to and from Firm B. In such a case, the conclusion would depend on other factors. If Firm B has a lot of market power, then such a merger might be beneficial as the combined A/C firm could exert a stronger competitive constraint on Firm B. However, if Firm B does not have a lot of market power, then despite A and C not being directly linked through transfers, such a merger might still end up being problematic.
- Mergers between any “central” firms such as Firm C and “fringe” firms such as Firm D or Firm E would likely be unproblematic. There are few direct links and so any merger would be unlikely to change the competitive scenario.
Conclusion: Using data science to help answer challenging questions
NLP is a powerful set of techniques, and – arguably – is the one with the most potential to add new sources of evidence to competition analysis. Given the exceptionally large volumes of text data that exists in industry and in the public domain, being able to resolve ambiguity in language and add structure can allow for novel ways of looking at problems. Of course, it is not a one-stop-shop to answer all difficult questions. Rather, it is an effective way to extract useful information, at scale, in a systematic and robust way that would otherwise be impractical to obtain.
Importantly, these techniques need to be applied with care. While it is simple to just pick off some algorithms from the shelf and throw them at your data, this will rarely be good enough for the rigorous standards required in competition analysis. In order for the analysis to be accepted by competition authorities, the analysis needs to be highly relevant, robust, and very clearly explained.
If done correctly and considered together with more traditional sources of evidence like market shares and diversion ratios, they can add a novel and valuable perspective on the issues at hand.
The set of use cases for NLP in competition is very large, and this only scratches the surface. Over the coming months, our data science team will discuss some different applications of NLP techniques.
About the Data Science Team
The Compass Lexecon Data Science team was created to bring the latest developments in programming, machine learning and data analysis to economic consulting.
Sometimes this involves applying novel techniques to assess specific questions in an innovative and compelling way. For instance, running a sentiment analysis on social media content related to merging firms can be informative on their closeness of competition, and can supplement the results of a survey.
Other times it is about making work faster, more accurate, and more efficient, especially on cases which involve large datasets.
This short article is part of a series of articles showcasing how data science can lead to more streamlined and robust economic analysis and ultimately to better decisions in competition cases. If you would like to find out more, please do not hesitate to contact us at datascience@compasslexecon.com.
[1] CMA, Merger Assessment Guidelines, March 2021, https://assets.publishing.service.gov.uk/government/uploads/system/uploads/attachment_data/file/1051823/MAGs_for_publication_2021_--_.pdf
[2] To account for this, the CMA guidance describes a very wide range of evidence types it considers when evaluating closeness of competition, including internal documents and customer or competitor surveys.
[3] This analysis was conducted by Compass Lexecon in a recent European Commission merger review.
[4] See for example, Dr Mattingly William, Introduction to Named Entity Recognition, 2021(2nd ed.) http://ner.pythonhumanities.com/01_01_introduction_to_ner.html
[5] For more on Dependency Parsing, see Daniel Jurafsky & James H. Martin, Speech and Language Processing. Chapter 14 Dependency Parsing. https://web.stanford.edu/~jurafsky/slp3/14.pdf
[6] We’ve anonymised the firm names here.
Related insights
-

Article • 21 Sept 2022
Measuring of Competition Using Natural Language Processing
-
Article • 04 Jul 2022
Providing New Evidence: Using AI in Merger Proceedings
-
Article • 05 Apr 2022
What your search is telling us: Using search data to assess competition


