Decision Search Tool: Behind the Scenes

Share
Written by Rashid Muhamedrahimov and Enrico Alemani [1]
Introduction
Software that provides powerful functionality can appear simple on the surface, but can hide plenty of fascinating technology. In this Data Science article, Rashid Muhamedrahimov and Enrico Alemani take a deep dive into the Compass Lexecon Decision Search Tool, an interactive web-app that allows users to search through competition authority decisions for specific terms or concepts and explore these results efficiently.
Building live analytics apps is a very different challenge from the usual data science work in economic consultancy. The Data Science team has built a continuously running product that deals with potentially evolving data, while remaining responsive to different user needs. In doing so, the team has had to deploy complex technologies in a robust way.
The challenge
Being able to search through legal precedent automatically and thoroughly is extremely valuable: it saves time and can reduce errors compared to more traditional approaches. Precedent search isn’t relevant just for lawyers, but also for economists looking up previous uses of specific tests, or academics studying decisional practice.
It is with this in mind that the Compass Lexecon Data Science team has built a Decision Search Tool, [2] an interactive web-app that allows users to search through competition authority decisions (on mergers, antitrust, state aid, etc) for specific terms or concepts, and efficiently explore results. By ensuring robust coverage and smart search technology, it enables competition practitioners to save time by having a single reliable place to find information and avoid either manual review or cumbersome indirect review through general web search engines.
Figure 1: Compass Lexecon Decision Search Tool

On the surface, the Compass Lexecon Decision Search Tool is straightforward – it allows the user to easily search through all public EC and CMA case documents. The user simply enters one or many keywords of interest, selects various filters (such as industry, authority, and dates), and the tool retrieves all matching documents and relevant extracts. An interactive graphing tool allows the user to better understand the overall breakdown of results or to understand the evolution of the topic over time.
For this to happen, the tool needs to ensure that:
c. Search results are returned quickly and in an intuitive waySome of this might sound simple on the surface, but in fact it requires a set of sophisticated technology. Figure 2 shows the various technological components that feed into the tool, and how they connect together.
Figure 2: The architecture of the Decision Search Tool

In the following, we discuss the various technologies and techniques that we used to bring this to life.[3]
On-time document downloads
In the absence of complete coverage and up-to-date documents, the Compass Lexecon Decision Search Tool would not be very reliable. So, a critical part of the Tool is the code and infrastructure that collects the decisions and their metadata.
Preparing such code for use in a live “production” app is a very different exercise from the usual economic consulting use-case. For example, working on a merger case in consulting involves extracting some data available online and the code is typically only run a few times, with a human monitoring the results every time. Here, the code runs regularly and without any supervision. It therefore needs to:
c. be efficient, so that we do not duplicate information that we already have while ensuring that we pick up anything new as soon as possible. This means being a “good web citizen” and not overbearing on the servers where the decisions are hosted, and using APIs where possible.To enable this, we have built an extensive codebase that extracts data from the relevant sources, transforms it into formats that are efficient to process, and loads it into a database that the Compass Lexecon Decision Search Tool can access.[4] This results in the tool having a consistent, up-to-date database spanning a wide time range and the full set of documents that are publicly available on competition cases.
Document parsing and layout analysis
PDF documents on competition authority websites contain a lot of useful information, but as many junior economists will have experienced, these are not in a format that is immediately useable at scale. In order to be able to search through PDF documents, we need to undertake a processing step called “parsing” – converting semi-structured PDF documents into structured data.
Several algorithms exist to conduct the parsing exercise, which we deploy off-the-shelf to quickly provide searchable text.[5] However, sometimes the simple parsers are not sufficient:
b. Decisions contain some information which users might not want to search through. For example, in some cases information in a footnote might be relevant for particular search, but in others it may just add noise.Solving this is far from trivial. While getting text from images (called “optical character recognition”) is relatively straightforward, telling computers which parts of a document are body text, titles, footnotes, etc is very difficult. This is because this isn't something that is codified anywhere in any specific set of rules. We as humans use our experience and intuition to know what is relevant and what is not – we “know” that large text normally implies a heading, that smaller text at the end of a page is normally a footnote etc.
It turns out that trying to codify this in a set of “rules” becomes impractical. Due to the large number of documents, in many different formats across many different years, the number of exceptions rapidly starts to exceed the number of rules.
As an alternative, we have developed a computer vision model, that uses deep learning to statistically identify what the different parts of a document are. This is the same field of modelling that attempts to identify objects in photos, for example whether an object in a photo is a human face, a bicycle etc. Applied to parts of documents, this exercise is called document layout analysis. Here the model attempts to replicate the human ability to distinguish layout elements by looking at their location on the page, the font size, the spacing between text blocks, etc.
Document layout analysis using deep learning is an active field of research, still in the early stages of development. This means there is limited resource available off-the-shelf, either in terms of data or existing models. Instead, we needed to select an appropriate model and “train” it from scratch on a relevant dataset. Here, we started with a baseline model from Facebook AI Research called Detectron2 [6] that was designed to have state-of-the-art performance in detecting physical objects.
With the model being selected, it then needs to be trained, i.e. it needs to be provided with a large set of example documents and their notations in order to learn what the different parts of the document are. To do so, we created a large novel dataset of labelled EC and CMA decisions consisting of roughly three thousand labelled images, and ran the training on a large server. [7] [8]
Once trained, the model is able to assess a given page of a decision, and determine which parts of the document are body text, which parts are tables, and so on. It does so statistically, so each prediction has a certain confidence. An example of the model’s predictions on two pages of CMA decisions are shown below.
Figure 3: Example of document layout analysis, with prediction confidence scores

The resulting outputs means we can separate each part of the text, identify the most relevant ones, extract them and generate a clean body text that can be quickly and easily queried by the user.
Search and document-oriented databases
But where does all of that data go? There are many ways to store data. A simple approach would be to just store it in a “flat file”, like in Excel. But of course, for high performance web applications we need something faster and more robust. A classic option would be to store the data in something like a tabular SQL database – these have been around for many years and are a very reliable and fast technology.
For the Compass Lexecon Decision Search Tool, we wanted something that allowed us some more flexibility and that would be more suitable to text data – which by nature is less “structured” than, for example, accounting data. In recent years, we have seen a rapid improvement and uptake of “document-oriented databases” (part of a category of databases referred to as “NoSQL”) such as MongoDB. These have the benefit of being much less restrictive in terms of structure. If we obtain some new metadata on a decision or the source material changes so that we can add some more information, this is possible with little configuration needed. This means that developers can spend less time on configuration and more time on building new features.
As well as storing information, a good database should allow users to retrieve information efficiently. There are approximately 30,000,000 individual words across the EC and CMA decisions database, and for a given keyword search input by the user, a search tool needs to effectively understand what the user is looking for and look through all of these words quickly.
Our tool includes several useful features for information retrieval. First, it allows users to conduct either “explicit” search or “fuzzy” search. In some situations, we might be interested in a specific technical term, such as “demand estimation” (the econometric technique) so would only want to see decisions where this is explicitly mentioned as such. In other cases, we may be interested in any type of approach where an “estimate” of demand was used (for example, internal company estimates of future demand, a statistical approximation, etc). There are likely many ways to specify such a query, so we have built into the Compass Lexecon Decision Search Tool the ability to conduct “fuzzy” matches, so that fuzzy queries such as “demand estimation” might return decisions which mention “demand estimate”, “estimate of demand”, “the parties estimate that demand is X”, and so on.[9]
Second, the search allows for complex queries, allowing for logic around operators such as AND & OR. So, to find results for telecoms cases that involved upwards pricing pressure (UPP) measures, users can conduct searches such as “telecoms AND upwards pricing pressure”. If the user is interested in telecoms, and either UPP analysis or indicative price rise analysis, they can search “telecoms AND (upwards pricing pressure OR indicative price rise)”.
Front-end
Collecting all of this information is useful, but without an easy interface for non-developers to interact with the database, its value is not very high.[10]
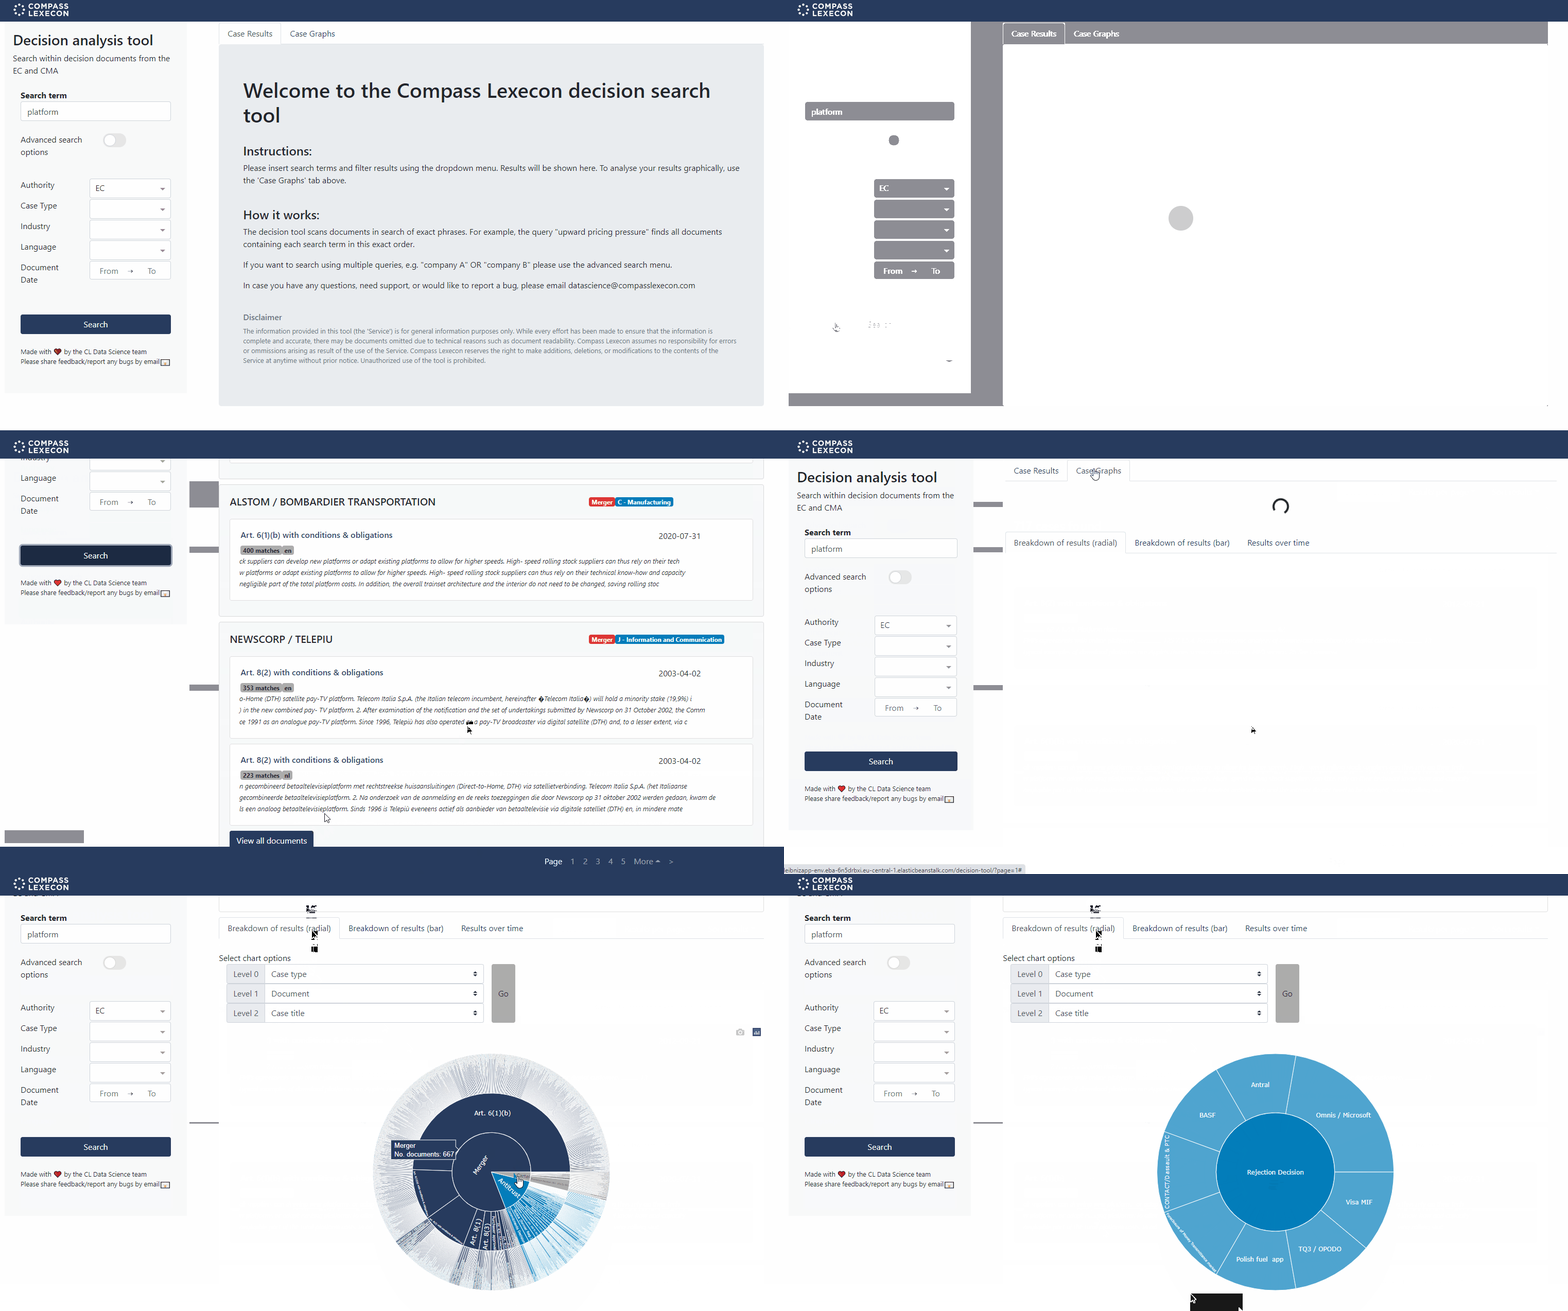
Our primary interface should be very familiar to anyone who has used internet search tools: it shows all relevant results, provides some metadata, and provides links to the individual documents and case decision pages. We’ve provided a few add-ons including different sort options and an ability to export results into an Excel file.
Figure 4: Search results in the Decision Search Tool

Simple lists of results can be useful to explore individual documents but isn’t the most effective way to see the whole picture. For example, we may want to know the discussion of a particular theory of harm has evolved over time or whether a certain analysis is more prevalent in merger cases compared to market investigations. For that, we’ve also built in a user-friendly interactive graphing interface.
Figure 5: Interactive charts in the Decision Search Tool

Conclusion
Building live analytics apps is a very different challenge from the usual data science work in economic consultancy. Typically in consulting, teams do “one-off” analyses, where data doesn’t change dynamically, the outputs are clearly defined, and we can monitor every step of the process. Here, we have built something that has to run continuously, deal with potentially evolving data, and be responsive to different user needs. In doing so, we have had to deploy complex technologies in a robust way.
The tool has already provided significant value to the consulting work done at Compass Lexecon, saving practitioners significant time in searching for key precedent. In addition to consulting work, it has enabled us to look at decisional practice in novel ways, for example by assessing the tools used by competition authorities to conduct market definition exercises.[11]
These techniques are not strictly limited to tool-building, but can also be used to improve the way we work with clients on cases. For example, by providing interactive visualisations (such as zoomable, clickable maps for local overlap cases), we can increase the speed and effectiveness with which specific competition issues are identified.
About the Data Science Team
The Compass Lexecon Data Science team was created to bring the latest developments in programming, machine learning and data analysis to economic consulting.
Sometimes this involves applying novel techniques to assess specific questions in an innovative and compelling way. For instance, running a sentiment analysis on social media content related to merging firms can be informative on their closeness of competition, and can supplement the results of a survey.
Other times it is about making work faster, more accurate, and more efficient, especially on cases which involve large datasets.
This short article is part of a series of articles showcasing how data science can lead to more streamlined and robust economic analysis and ultimately to better decisions in competition cases.
If you are interested in finding out more on our Data Science offering or the Compass Lexecon Decision Search Tool, please contact datascience@compasslexecon.com.
[1] We would like to thank you Catalina Larrain, Kitti Perger, Justice Yennie and Sasha Guest for the help and support provided to make this project successful.
[2] Nicknamed Project Leibniz, in honour of the German philosopher Gottfried Leibniz, who worked on many things which revolved around the theme of turning human law into an exercise in computation.
[3] Previous work discussing analysis of EC merger decisions is available here.
[4] In data engineering this is typically referred to as an “extract-transform-load (ETL)” pipeline. To enable this to run autonomously and reliably, it is hosted on cloud computing infrastructure.
[5] Examples include the “Apache Tika” parser.
[6] Detectron2 was originally designed for detecting physical objects in images (e.g. people, cars, bicycles etc), and segmenting the section of the image where that object is contained. It does so by recognising the individual shapes that make an object; in the case of a car it would recognise the wheels, the front/rear bumper, the flat roof and the trunk.
[7] As this is an ongoing research field, we would be happy to make this dataset available for research purposes. Please contact the authors for more information.
[8] Our trained model achieved a mean average precision (MAP) of above [0.88] across all layout items, and MAP above [0.92] for footnotes and body text. In words, the model performed relatively well on our task. [Figure 3] show a few examples of the layout predicted by the model, including the confidence scores. MAP @ intersection over union (IOU) [0.50:0.95] as used In COCO competition.
[9] This is enabled by a query engine that uses Lucene, a sophisticated search library, and a specific Analyzer, a data pre-processing approach which systematically converts the text data from decisions to make the text more generalized and searchable.
[10] As Python-loving data scientists (and most certainly, not full-time web developers or javascript experts), we needed a framework that allowed us to use our favourite programming language while still allowing the functionality that modern web frameworks provide. In the end we settled on using Flask as our web framework, with Plotly Dash as an abstraction layer to provide easy use of various web components (such as forms, dropdowns, etc).
[11] See Perkins (2021) Market definition in principle and practice.


