What do markups tell us about competition and merger control in Europe?

Share
Debate about antitrust policy is fuelled, in part, by concern that it has failed to prevent an increases in firms’ pricing power over the past 30 to 40 years. Ian Small [1] reviews the evidence on how markups have evolved in Europe and finds that we should not accept that concern at face value.
View the PDF version of this article.
The views expressed in this article are the views of the authors only and do not necessarily represent the views of Compass Lexecon, its management, its subsidiaries, its affiliates, its employees or its clients.
Introduction
There is an ongoing debate about whether antitrust policy, and specifically merger policy, has been too lax. In part, that debate has been fuelled by evidence that pricing power has substantially increased over the previous three to four decades, with firms charging materially higher prices relative to their marginal costs (in effect, increasing their gross profit margins). In Europe, that evidence is limited: much of the analysis examines markets in the US, and markups are rarely, if ever, directly observed; they must be estimated, and therefore, depend highly on the analytic approach and data.
In this article, I review the available evidence on how markups have evolved in Europe and consider whether it tells a plausible story about how the competitive pressure on European firms has changed over time, and what that implies for policy on merger control. Neither the findings, nor their implications, should be accepted at face value. Although the estimates suggest that the average markup for European firms has increased substantially, the specific trends are difficult to reconcile with our understanding of economic performance in each country, or our experience of merger control.
That is not to say limited or partial evidence is uninformative. Often, it can be. But only if we assess it in context from all angles, considering what else it implies about competition, and whether those implications are consistent with what we know about economics, and what we observe in the economy generally and antitrust policy specifically. Placed in that wider context, even partial information can enhance our understanding, rather than direct it off course.
Ultimately, to establish whether or not merger policy has failed to prevent an increase in markups, we really need retrospective assessments of specific mergers. Those would demonstrate how mergers have actually affected markups and prices. While there are well established techniques that can be used to estimate these effects, few studies exist. Those that do, find that the mergers they review have typically led to small increases in prices at most.
How have average markups evolved in Europe?
Most of the evidence that markups have increased focuses on the US. In a very influential article, De Loecker, Eeckhout & Unger (DEU) [2] use company accounts data for a very large sample of US firms to estimate firm markups. They report that the sales weighted average firm markup in the US has increased from 1.21 in 1980 to 1.61 in 2016 – i.e., the average gross margins of US firms increased from 17% on average to 38%. A number of other papers form the same conclusion about average markups in the US; although depending on their approach and data, there are significant differences in both the size of the increase in the markup and when that increase occurred.[3]
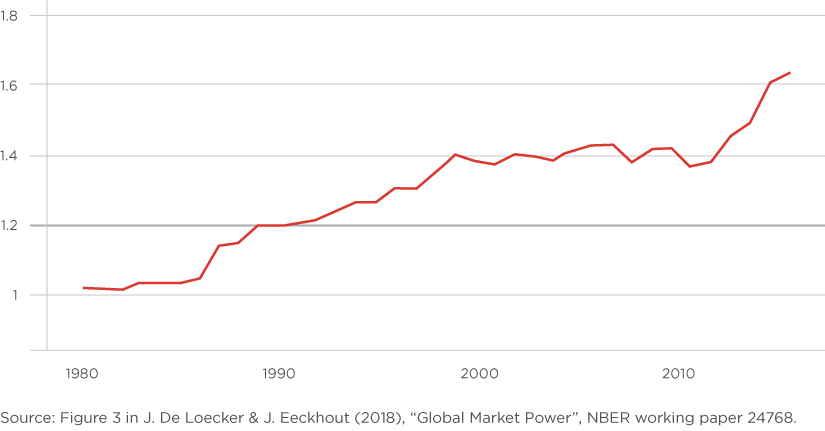
With the partial exception of the UK, there is very limited evidence on how average markups in Europe have evolved over the previous 30 to 40 years.[4] The main evidence comes from a paper by De Loecker and Eeckhout (DE).[5] Using company accounts data for a very large sample of listed firms covering most European countries and the same approach DEU used to estimate the average markup in the US, DE estimate that the average markup in Europe has increased substantially since 1980.[6] As Figure 1 shows, the starting point was low: DE estimate that in 1980 the average markup in Europe was just over 1.0, so prices only narrowly exceeded marginal costs.[7] Then, from the mid-1980s onwards, the average markup in Europe increased steadily, reaching about 1.4 in the late 1990s. Average markups were fairly constant during the 2000s, but from 2012 onwards, they increased sharply to reach 1.64 (which is equivalent to a gross margin of 37.5%) in 2016.
Figure 1: Average sales weighted firm markup in Europe, 1980-2016

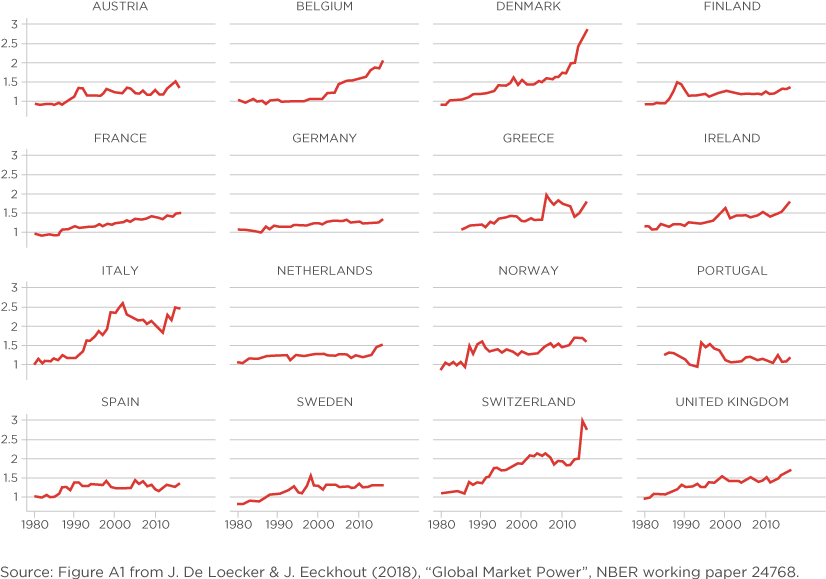
DE also report how average markups have evolved in 16 Western European countries over the same period, and find different trends across these countries. DE estimate that (from a low starting point) markups increased in all but one of these countries – Portugal is the sole exception. However, the extent of these increases varies considerably as shown by Figure 2. In Switzerland, Denmark, Italy and Belgium, DE estimate average firm markups have increased from about 1.0 to well over 2.0, meaning that they estimate the average gross margin in those countries is greater than 50%.
The path that average markups take also varies by country. In about half of these countries there was a fairly steady increase in the markups over the whole period.[8] In the other countries, the average markup increased in spurts, at different times, for different durations, and to different extents. In particular, in Belgium the average markup was essentially constant at just above 1.0 until 2000, after which it increased fairly steadily to reach 2.0 in 2016; in Denmark and Switzerland there was a fairly steady increase in the average markup over most of the period, followed by a sharp increase; [9] in Italy, the average markup increased slightly during the 1980s, soared from the early 1990s to reach 2.5 by the early 2000s, then declined to about 1.8 in 2012 before returning to 2.5 by 2016; and in Austria, Spain and Norway the average markup was broadly constant in the first half of the 1980s, before increasing in the mid to late 1980s, and was then broadly constant until towards the end of the period, when it increased in Austria and Norway, but not in Spain.
Figure 2: Average markups in European countries, 1980-2016

What do DE’s findings imply about competition and merger control?
Mark-ups don’t just change. They imply other conditions we can examine and test. If DE’s estimates provide an accurate picture of how European firms’ markups have typically evolved over the period, then these estimates imply that consumers are much less sensitive to price changes, and/or competition between firms has become less intense. We can see this using the Lerner condition – a known economic relationship between a firm’s markup and the elasticity of the firm’s residual demand. The latter depends on the consumers’ sensitivity to price changes and how firms compete with each other, so any estimate that firm markups have increased implies that at least one of these two factors has changed.
Table 1 shows the decline in the elasticity of the residual demand curve implied by DE’s estimates of the average markup in Europe. The estimates imply that consumers were extremely sensitive to prices in 1980, but by 2016, they had become considerably less sensitive, with much of that decline occurring in the period prior to 2000. The timing and extent of consumers’ declining price sensitivity varies in each country, reflecting the variation in DE’s estimates of markups. The general trend mirrors evidence from the US. For instance, Miller et al. have examined branded consumer products and concluded that American consumers are less price sensitive than they used to be, but not to the extent that corroborates the decline implied by DE’s estimate of markups in Europe.[10]
Table 1: Residual demand elasticities implied by DE’s average markups for Europe

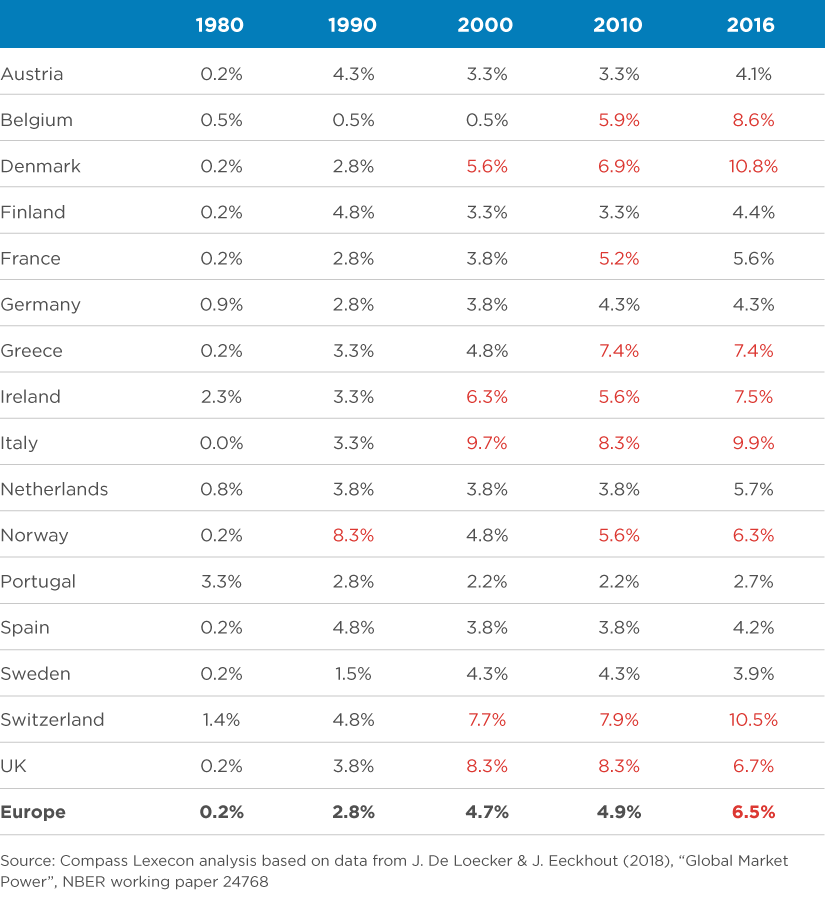
We can illustrate what DE’s estimates imply for merger control by considering what would be the expected impact on prices from a hypothetical merger of two firms with markups equal to the average (mean) estimated by DE. Table 2 shows how the impact of that hypothetical merger would have changed over time as the average markup increased. In 1980, it would have led to only minimal price pressure in the vast majority of these countries. Even if it had taken place in 1990, then only in one country (Norway) would the merger have led to price pressure of more than 5%. However, by 2000, DE’s findings imply that the merger would have led to price pressure of more than 5% in five countries, and by 2010 the merger would have led to at least 5% of price pressure (and often substantially more) in nine countries, increasing to 10 countries in 2016.
Table 2: Illustrative price increases for a merger of firms with DE’s estimated markups

Thus, taken at face value DE’s estimates of average markups suggest that over time the competitive pressure faced by the typical European firm has declined. Consistent with this we would expect an increasing number of mergers would be raising competition concerns. However, the actual experience of merger control is that since 1990 both the number and proportion of mergers that the European Commission has either blocked or approved with remedies has remained low.
Figure 3: Proportion of EC reviews where the merger is withdrawn, prohibited, or cleared with remedies

Source: Compass Lexecon analysis based on data from European Commission statistics
Are DE’s markup estimates representative of firms involved in mergers?
The difference between the expectation that an increasing number of mergers should be raising competition concerns and the actual experience of merger control, could reflect European merger control becoming increasing lax over time, but this seems questionable. Alternatively, it could be that DE’s estimates of average firm markups are not representative of the actual markups of firms who have been involved in the mergers reviewed by the European Commission.
In their US paper that uses the same approach and company level data, DEU find that the increase in the sales weighted average markup of US firms is driven by a small number of firms with increasingly high markups (N.B. these are not necessarily the same firms over the whole period), and the markups of most US firms have not increased over the period. Specifically, DEU report that markups at the top end of the markup distribution have increased materially, especially right at the top of the distribution (i.e. at the 90th percentile and above), and the markups of firms in the bottom half of the markup distribution have not increased.
Moreover, DEU also find that there has been a shift in sales towards those firms with very high markups, which has reinforced the effects of the increase in markups at the top of the distribution on the sales weighted average firm markup. As a consequence of these two effects, DEU show that the increase in sales weighted average markup in the US is due to a few firms that account for a large proportion of sales in their sample having much higher markups, and that most of the other firms in their sample have experienced no increase in markups since 1980.
If, as in the US, the increase in the average markup in Europe is due to a small number of large firms with increasingly high markups and most European firms experiencing no or little increase in their markups over the period, then it is possible that the markups of most firms involved in mergers reviewed by the European Commission have effectively been broadly constant over the previous 30 years, so the competition faced by these firms has not declined and the price pressure resulting from a merger of these firms would also have remained broadly constant. Moreover, if a merger did involve one of the small number of firms with high markups, then it would be relatively straightforward for the Commission to investigate the reasons for these high markups and so take account of them in its merger assessment.
Alternative estimates of whether European markups have increased
Since it is questionable whether DE’s estimates of the average markups in Europe provide an accurate guide of the markups of typical European firms, and because estimates of the markup are sensitive to the approach and data used to estimate them, I have used an alternative approach to estimate whether markups have increased, along with a different dataset.[11]
Markups express the relationship between product prices to the costs of producing them, including the cost of labour or intermediate inputs. The economics of that relationship is understood, such that if markups increase that should have other consequences that we can test and confirm. Specifically, the average markup should be equal to the ratio of labour’s output share to its output elasticity, so if we (temporarily) assume that labour’s output elasticities are constant over time, then any change in labour’s share of output – which we can easily observe – must reflect an offsetting change in the average markup: if labour’s share reduces, the mark-up must have increased, and vice versa.
Table 3 compares the percentage changes in average markups implied by the observed changes in labour’s share of output, with the percentage changes in DE’s estimates in Germany, France, Italy, Spain and the UK for the period 1995 to 2016/7: as the trend in labour’s share is affected by the financial crisis, equivalent figures for the periods before and after the financial crisis are also reported.
Table 3: Comparison of changes in estimated markups, 1995-2016/7
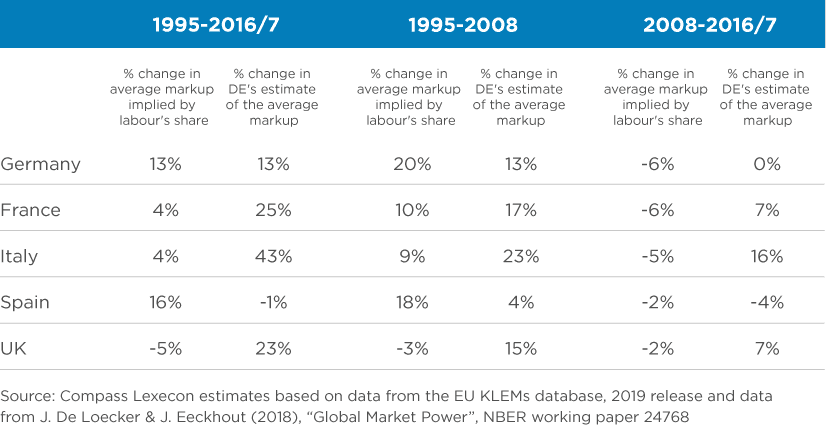
The movements in labour’s share of output between 1995 and 2017 paint a very different picture compared with DE’s estimates. According to DE’s estimates over the period 1995 to 2016 there were large increases in average markups in France (25%), Italy (43%), and the UK (23%), but the changes in labour’s share of revenue imply that the average markup increased by just 4% in both France and Italy, and declined by 5% in the UK. Similarly in Spain, while DE’s estimates show the average markup declining by 1% between 1995 to 2016, the changes in labour’s output share imply that it increased by 16%. There are also differences in how the average markup changed over the period in these four countries.
The only one of the five countries where the two sets of estimates show a similar increase in the average markup over the period is Germany, where they both show a 13% increase over the whole period. However there are still material differences between the two sets of estimates in how the average markup evolved over the period. While DE’s estimates show that the average markup in Germany increased prior to the financial crisis by about 13% and was then broadly constant, the changes in labour’s output share imply that the average markup increased by 20% prior to the financial crisis and then declined by 6%.
Of course, the assumption that labour’s output elasticity was constant over time in each country may not be correct (although, in the US DEU report that output elasticities have been broadly constant over time). But, if we relax that assumption, the relationship between mark-ups and labour’s output elasticity still has to obey the economic relationship between the two. Given that we can observe labour’s share of output, we would require very large, and very different, changes to the output elasticity in each country in order to reconcile our estimates of mark-ups with DE’s. Changes of that scale and disparity between countries are hard to believe without very strong evidence to support them. Moreover, DE’s markup estimates for Europe are based on the output elasticities estimated in their US work, and output elasticities in Europe may differ from those in the US.
Conclusion
Claims that firm markups have materially increased in Europe, and hence merger control needs to be tightened, should not be just accepted at face value. There is little evidence on how average firm markups have evolved in Europe over the previous 30 to 40 years; it is not clear whether this evidence shows how typical European firms’ markups have evolved and the estimates of markups are sensitive to the approach and data used to estimate them.
When considering merger policy in particular, we need analysis to be more specific. That requires retrospective assessments of mergers that provide evidence on how mergers have actually affected markups and prices. While there are well established techniques that can be used to estimate these effects, unfortunately only a limited number of retrospective merger assessments exist. However, the few that exist are encouraging. For instance, a survey done in 2016 for the European Commission found that, in the sample of mergers that have been examined, mergers typically lead to small price increases at the most.
View the PDF version of this article.
Read all articles from this edition of the Analysis
[1] The views expressed in this article are the views of the author only and do not necessarily represent the views of Compass Lexecon, its management, its subsidiaries, its affiliates, its employees or its clients.
[2] De Loecker, Eeckhout & Unger (2020), “The Rise of Market Power and the Macroeconomic Implications”, The Quarterly Journal of Economics, Vol.135, Issue 2.
[3] See, Dopper, MacKay, Miller & Stiebale (2022), “Rising Markups and the Role of Consumer Preferences”, Working Paper. Hall (2018), “New Evidence on Market Power, Profit, Concentration and the Role of Mega-Firms in the US Economy”, NBER Working Paper 24574. Traina (2018), “Is Aggregate Market Power Increasing? Production Trends using Financial Statements”, Working Paper. Barkai (2020), “Declining Labor and Capital Shares”, The Journal of Finance, Vol. LXXV, No. 5.
[4] In the UK, the CMA and the Bank of England have both estimated how average markups have evolved over time.
[5] De Loecker & Eeckhout (2018), “Global Market Power”, NBER working paper 24768.
[6] DE estimate the average markup in each year in each European country by dividing the output share of intermediate inputs (measured by the costs of goods sold (COGS) in the company accounts - COGS covers the costs of labour, materials, etc. directly used in the production of the goods/services), by an estimate of the output elasticity for each 2-digit industry. The estimates of the industry output elasticities are taken from their US paper, are econometrically estimated using the company account data, and vary by year.
[7] The early 1980s was a period of recession in most European countries following the second oil price shock.
[8] These countries are Finland, France, Germany, Ireland, the Netherlands, Sweden and the UK.
[9] There was a marked increase in the average markup at the end of the period in Greece and Ireland.
[10] In the US, Miller et al, have examined branded consumer products and concluded that consumers have become less price sensitive than they used to be, but not to the extent that would explain this decline in markups.
[11] The EU KLEMs database. Available at: https://euklems.eu/.
Related insights
-

The Analysis • 23 Nov 2022
Have European authorities been stricter with tech mergers?
-
Article • 16 Nov 2022
New Merger Guidelines Should Keep the Consumer Welfare Standard
-
Article • 06 Jul 2022
Expert Q&A on horizontal and vertical merger enforcement


